Resources
This carefully curated collection of resources will help you find packages and learning resources to help you on your R journey.
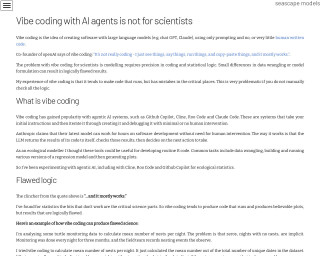
'Vibe coding' with AI agents in scientific research
The article provides a critical perspective on 'vibe coding' with AI agents in the context of scientific research. Vibe coding involves creating software using large language models (e.g. ChatGPT, Claude) through prompting and minimal human-written code. It highlights the risks of relying on AI for coding tasks that require precision, such as data wrangling and model formulation in scientific research. The author shares experiences with agentic AI systems and discusses the potential for producing logically flawed results due to over-engineering and a lack of manual logic checks. Guidance on safely using AI agents for scientific coding is offered.
Go to Resource
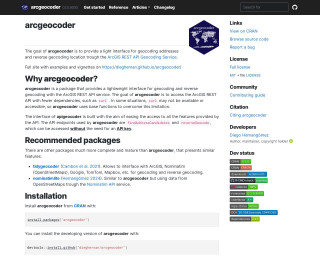
{arcgeocoder} package for geocoding
arcgeocoder is an R package that serves as a lightweight interface for geocoding and reverse geocoding using the ArcGIS REST API Geocoding Service. It allows R users to easily convert addresses to geographic coordinates and vice versa without needing an API key. The package is designed to work with base R functions, avoiding dependencies like curl, making it accessible in environments where curl isn't available. arcgeocoder is advantageous when quick and simple access to geocoding services is needed, and it includes functions like arc_geo() for geocoding and arc_reverse_geo() for reverse geocoding.
Go to Resource
{datapasta} came up at #CascadiaRconf
Libby Heeren highlights the {datapasta} R package, particularly useful for copying tables from various sources and pasting them into R as a tibble or other data structures. She praises the package's efficiency and its contribution to reproducibility in data handling. The community shares positive feedback, with many expressing a desire to use the package for its convenience and reproducibility benefits. An updated version is recommended from GitHub, as the CRAN version is not the latest. The post indicates a strong appreciation for {datapasta} within the R community.
Go to Resource
{FakeDataR}
{FakeDataR} is an R package that provides a local solution for creating synthetic copies of real datasets, preserving their structure, schema, types, and privacy. It prevents the risk of exposing sensitive data and is designed to support Large Language Model (LLM) workflows and reproducible sharing. The package includes heuristics for identifying sensitive fields, with the ability to fake or drop them, and supports exporting synthetic data along with a JSON schema and README prompt for LLM bundles. It's a suitable tool for creating quick, privacy-preserving synthetic data without the need for cloud processing.
Go to Resource
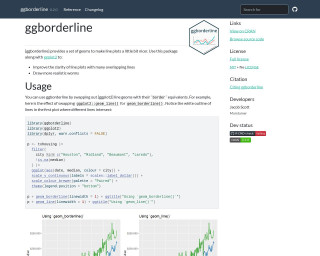
{ggborderline}
The ggborderline package enhances ggplot2 line plots with geoms that add an outlined effect, improving clarity for plots with overlapping lines. It's ideal for visualizing 'worm' style data. Users can replace ggplot2 line geoms with border equivalents to achieve a white outline where lines intersect, with settings for borderwidth and bordercolour these subtle enhancements can be adjusted. Additionally, the package makes the borders visible in the plot's legend. Installation instructions include CRAN and GitHub options, inspired by a need to avoid indistinct lines in complex visualizations, offering an aesthetic alternative to ggplot2's capabilities.
Go to Resource

{legendry}
The 'legendry' package is a new ggplot2 extension for improving guide options in R plots, now available on CRAN. It provides tools for flexible and reproducible placement of annotations within figures, avoiding the need for post-editing in external software. Originating from the author's earlier work on 'ggh4x', 'legendry' enhances guides in ggplot2 by using the ggproto system. The package includes vignettes and aims to simplify the customization of scale guides. With 'legendry', users can introduce manual keys and complete guides, such as 'guide_axis_nested' for ranges or 'guide_legend_groups' for groups, thereby expanding visualization capabilities.
Go to Resource
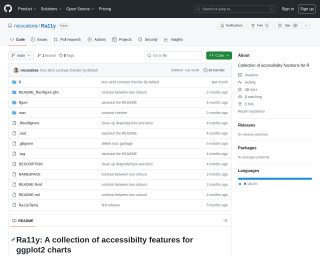
{Ra11y} package: Collection of accessibility functions for R
Ra11y is a public GitHub repository created by user nicucalcea, which hosts a collection of accessibility functions designed for R programming. The project aims to enhance accessibility within R and contains resources for developers to utilize these functions in their work. With 18 stars and 1 fork, the repository appears to be modestly popular within the community. The repository is fully coded in R and provides documentation to help users understand and implement the functions for their accessibility needs.
Go to Resource
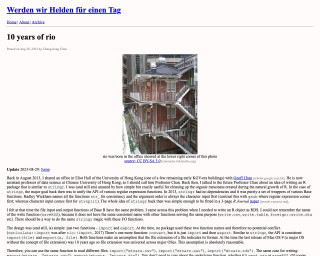
10 years of rio
This is a blog post titled '10 years of rio' by Chung-hong Chan. It discusses the history and development of the R language package 'rio', which is similar to stringr. The author talks about the motivation behind creating the package and the design principles used. The package provides functions for importing and exporting data in various formats, with a consistent API. The post also mentions the compatibility of the package with older versions of R.
Go to Resource
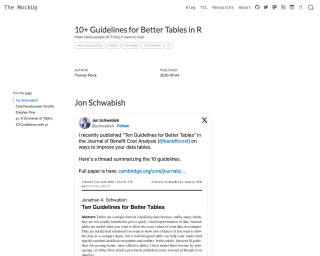
10+ Guidelines for Better Tables in R
The MockUp - 10+ Guidelines for Better Tables in R
Go to Resource
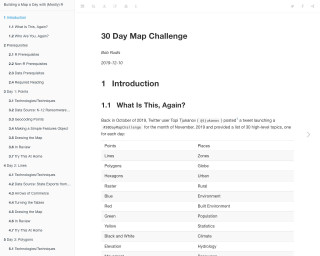
30 Day Map Challenge
Building a Map a Day with (Mostly) R is a 30-day challenge where each day, a map is created using R. The challenge covers various map types and techniques using different data sources. The tutorial provides step-by-step instructions on how to create each map and includes code examples. The challenge is suitable for those who are familiar with R and want to enhance their mapping skills.
Go to Resource
3D city building maps with R - YouTube
This YouTube video is about creating 3D city building maps using R.
Go to Resource
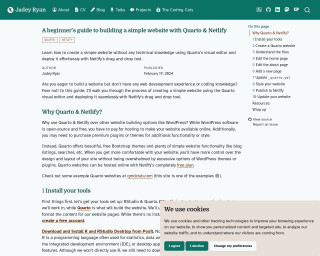
A beginner’s guide to building a simple website with Quarto & Netlify
This content is a tutorial for beginners on creating a simple website using Quarto and deploying it with Netlify. It guides users through the installation of RStudio and Quarto, the process of creating a Quarto website, and understanding the necessary files. The guide highlights the benefits of using Quarto and Netlify over other website platforms and provides a stress-free approach for those without web development experience. It includes step-by-step instructions to ensure even complete novices can achieve a professional online presence quickly and easily.
Go to Resource