Resources
This carefully curated collection of resources will help you find packages and learning resources to help you on your R journey.

Access and Manipulate Comprehensive Country Level Data in Tidy Format • tidycountries
The tidycountries package in R provides a comprehensive interface for accessing and manipulating country-level data. It includes details such as names, regions, populations, currencies, and more in a tidy format that integrates with the tidyverse. It's useful for global research, visualizations, and querying country information. The package can be easily installed from CRAN or GitHub and integrates well with the tidyverse, making data manipulation straightforward.
Go to Resource
Add last rendered or modified time to Quarto
Garrick Aden-Buie's blog post introduces 'now,' a Quarto extension that allows the automatic update of time information in Quarto documents. This extension saves time by eliminating the need for manual updates of dates in documentation footers. By adding the extension using 'quarto add gadenbuie/quarto-now,' Quarto users can employ shortcodes like '{{< now >}}' and '{{< modified >}}' to display the current or last modified time. The extension supports customization of time output formats and may significantly streamline Quarto project maintenance by ensuring date accuracy without manual intervention.
Go to Resource

Adding a logo to images with {magick} and {purrr}
Jadey Ryan shared her experience with automating the process of adding logos to images using the R packages {magick} and {purrr}. She also highlighted new merchandise such as tote bags and embroidered hats on her Etsy shop. Additionally, she announced a free webinar series on soil health where she will demo the {soils} R package. Alongside, she informed about the Parameterized Quarto workshops she is giving, focusing on efficient report generation using R and Quarto, with the next one scheduled with R-Ladies Abuja.
Go to Resource
Adding social media icons to charts with {ggplot2}
Adding social media icons to charts with {ggplot2}
Go to Resource

Advanced Reproducible Research in R
This content covers an advanced workshop titled 'Advanced Reproducible Research in R,' designed to teach collaborative and automated analysis pipelines in scientific research. It emphasizes the importance of reproducibility and open scientific practices, presenting solutions to challenges such as coding standards, software dependency documentation, and data analysis automation. The course uses a code-along format with real-world datasets, created with Quarto, GitHub, and GitHub Actions. The material is available on a website and the r-cubed-advanced GitHub repository, licensed under Creative Commons for open use and modification.
Go to Resource
Air 0.7.0
Air 0.7.0 is a newly released version of a powerful R formatter known for its speed, announced by Davis Vaughan and Lionel Henry. It includes updates from versions 0.5.0 to 0.7.0 with enhanced Positron support, a 'autobracing' feature for formatting code blocks, and a GitHub Action for automation. The Air extension comes bundled with Positron, ensuring automatic updates and a seamless experience. The release simplifies adding Air to projects with usethis::use_air(), formatting configuration, and the promotion of consistent coding styles across various editors. It also introduces autobracing for if statements and loops to improve code portability.
Go to Resource

Air, an extremely fast R formatter
Air is an innovative R formatter designed to enhance code readability and maintainability. On February 21, 2025, Davis Vaughan and Lionel Henry introduced Air, boasting exceptional speed in formatting R code. Air automates the styling process, seamlessly integrating with the Positron environment and RStudio. It can reformat individual files on save or entire projects using a terminal command. Key features include instantaneous formatting and smart file recognition to exclude generated files. Air is ideal for tidyverse packages like dplyr and is available as an extension for Positron and VS Code, alongside command line installation options.
Go to Resource
Albert Rapp - Creating interactive visualizations with {ggiraph} (with or without Shiny)
Creating interactive visualizations with ggiraph (with or without Shiny)
Go to Resource
Albert Rapp - Four reasons to learn HTML + CSS as an R programmer
Four reasons to learn HTML + CSS as an R programmer
Go to Resource
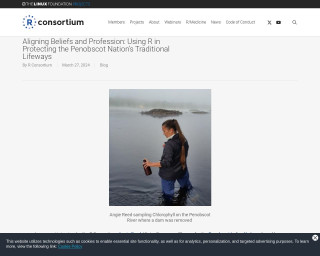
Aligning Beliefs and Profession: Using R in Protecting the Penobscot Nation's Traditional Lifeways
In an interview, Angie Reed, Water Resources Planner for the Penobscot Indian Nation, shares her journey with R, from statistics to river conservation. Beginning with the Houlton Band of Maliseet Indians and later joining the Penobscot Indian Nation, she uses R to blend traditional views with modern technology. This enables engaging community involvement and environmental protection. Her work involves river stewardship, education in R coding, and development of an interactive R Shiny app for the local community, underscoring how R can be instrumental in preserving traditional lifeways and promoting sustainability.
Go to Resource
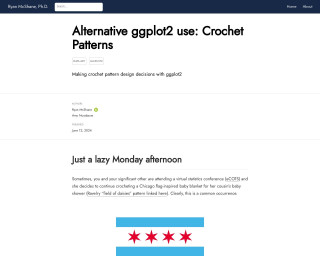
Alternative ggplot2 use: Crochet Patterns
Ryan McShane, Ph.D. demonstrates an unconventional use of ggplot2 to aid in crochet pattern design decisions. While attending a virtual statistics conference, McShane's partner works on a Chicago flag-inspired crochet baby blanket. To assist with visualizing the design, McShane employs ggplot2 to represent different pattern possibilities for the granny square arrangement, effectively combining data visualization with crafting. The article includes code snippets and detailed explanations on how to implement this creative application of ggplot2, turning a statistical tool into an artistic aid.
Go to Resource
An Exploration of Simple Features for R
Introduction to GIS with R through the sp and sf packages.
Go to Resource