Resources
This carefully curated collection of resources will help you find packages and learning resources to help you on your R journey.

A Comprehensive Collection of Crime-Related Datasets • crimedatasets
The crimedatasets package in R provides an extensive array of crime-related datasets. It's tailored for users interested in crime analysis, criminology, and studying socio-economic factors related to criminal activity. It offers a broad range of data types including tables, tibbles, spatial data, and time series, each with a specific naming convention for ease of use. Installation is straightforward via CRAN, and the package puts various global and local crime datasets at one's fingertips for research and educational purposes, such as datasets on US cybersecurity breaches and New Zealand murders.
Go to Resource

A Comprehensive Collection of U.S. Datasets • usdatasets
The usdatasets package provides an essential collection of U.S.-specific datasets suitable for analysis in various fields like crime, economics, education, and healthcare. It includes datasets with suffixes denoting their type, aiding in identification and usage. The package can be installed from CRAN and is easy to use, making it a valuable tool for researchers and analysts working with U.S. data. It follows a consistent naming convention to indicate data structures, such as time series (_ts) or data frames (_df), simplifying the data analysis process.
Go to Resource
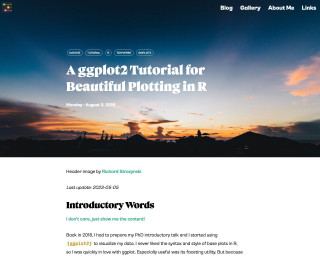
A ggplot2 Tutorial for Beautiful Plotting in R
A ggplot2 tutorial for beautiful plotting in R by Cédric Scherer
Go to Resource
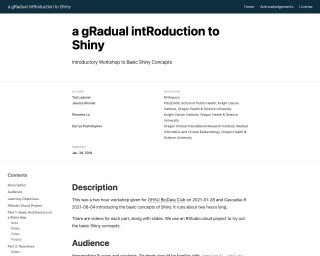
a gRadual intRoduction to Shiny
A gradual introduction to Shiny is a two-hour workshop that introduces the basic concepts of Shiny, a web application framework for R. The workshop covers the basic architecture of Shiny apps, how the server and UI communicate, adding ggplot2 code to an app, creating reactive datasets, and adding tooltips with plotly. The workshop is designed for intermediate R users and students familiar with ggplot2, dplyr, and functions.
Go to Resource
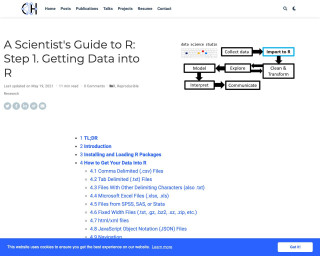
A Scientist's Guide to R: Step 1. Getting Data into R
A tutorial on getting data into R, covering various file formats like .csv, .txt, .xlsx, etc.
Go to Resource
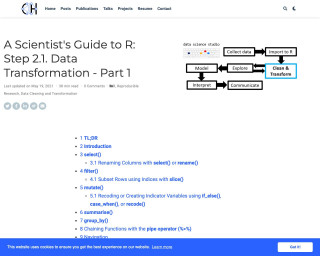
A Scientist's Guide to R: Step 2.1. Data Transformation - Part 1
This post is part of the Scientist's Guide to R series and focuses on data transformation techniques for wrangling, tidying, and cleaning data. It introduces the core functions of the dplyr package, as well as other relevant functions in base R. The post covers topics such as selecting columns, filtering rows, modifying columns, obtaining descriptive summaries of data, assigning grouping structures, and arranging data frames. The post also mentions the data.table package for working with large datasets. The examples in the post demonstrate how to use the select() function from the dplyr package to subset columns from a data frame.
Go to Resource
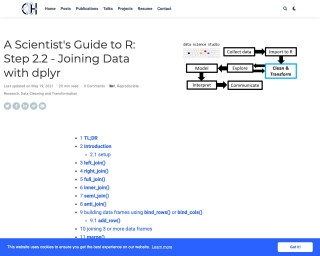
A Scientist's Guide to R: Step 2.2 - Joining Data with dplyr
This post is part of the Scientist's Guide to R series and focuses on using joins to combine data frames in R with the dplyr package. It covers different types of joins, such as inner, left, right, full, semi, and anti join, as well as using bind_rows() or bind_cols() to build data frames. The post also mentions the merge() function in base R for joining data frames.
Go to Resource
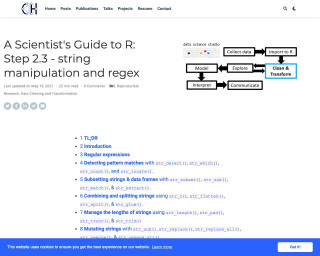
A Scientist's Guide to R: Step 2.3 - string manipulation and regex
A Scientist's Guide to R: Step 2.3 - string manipulation and regex
Go to Resource
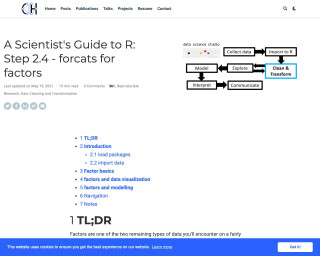
A Scientist's Guide to R: Step 2.4 - forcats for factors
This post is part of a series called A Scientist's Guide to R and focuses on how to work with factors in R using the forcats package.
Go to Resource
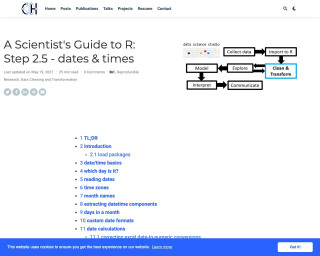
A Scientist's Guide to R: Step 2.5 - dates & times
A Scientist's Guide to R: Step 2.5 - dates & times is a blog post that provides a guide on how to work with dates and times in R using the lubridate package. It covers topics such as date/time basics, reading dates, time zones, month names, extracting datetime components, custom date formats, date calculations, and planning a behavioural neuroscience experiment. The post aims to help readers handle dates and times effectively in R.
Go to Resource
A SIMPLE guide to create BUMP CHARTS with ggplot2 - YouTube
A YouTube tutorial on creating bump charts with ggplot2
Go to Resource
A timeline of R's first 30 years
This content celebrates the 30th anniversary of the R language with a timeline highlighting significant milestones, packages, and papers. Developed by Tim Brock, Colin Gillespie, and the Jumping Rivers Team, it showcases R's evolution and invites contributions through social media. The standalone timeline is inspired by a figure in a publication on R's role in bioinformatics and data science. Jumping Rivers offers related training and a newsletter.
Go to Resource