Resources
This carefully curated collection of resources will help you find packages and learning resources to help you on your R journey.
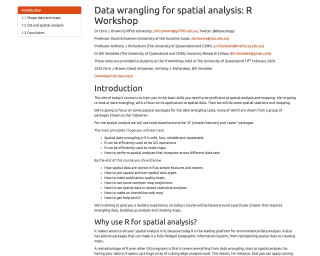
Data wrangling for spatial analysis: R Workshop
Data wrangling for spatial analysis: R Workshop
Go to Resource
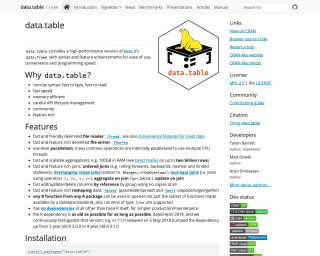
data.table
data.table provides a high-performance version of base R’s data.frame with syntax and feature enhancements for ease of use, convenience and programming speed.
Go to Resource
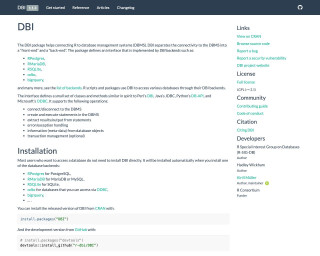
DBI
The DBI package helps connecting R to database management systems (DBMS). It separates the connectivity to the DBMS into a “front-end” and a “back-end” and provides an interface that is implemented by different DBI backends. The package supports operations like connecting to a DBMS, executing statements, extracting results, and handling errors. The DBI package is typically installed automatically when you install one of the supported database backends.
Go to Resource
dbplyr
dbplyr is a database backend for the dplyr package in R. It allows you to use remote database tables as if they are in-memory data frames by automatically converting dplyr code into SQL.
Go to Resource

Dengue Data Hub
The Dengue Data Hub is a centralized platform that provides access to global dengue-related data across 225 countries. Launched and managed by Dr. Thiyanga S. Talagala, the hub is funded by the R Consortium, based in the USA. It is designed to facilitate the research and analysis of dengue fever patterns and trends. Users can explore and download datasets to study the impact of the disease, understand its prevalence, and potentially aid in the development of preventative measures. Researchers looking for dengue data can contact Dr. Talagala for more information.
Go to Resource
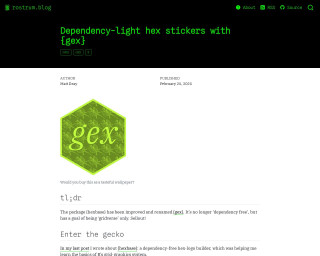
Dependency-light hex stickers with {gex}
Rostrum.blog introduced a new R package, {gex}, formerly known as {hexbase}, for creating hexagon stickers. It aims to be lightweight by including only 'gridverse' packages. 'Gex' is a play on 'grid' and 'hex'. The post explains how {gex} differs from {hexbase} in creating hex stickers with R's grid system, using functions like add_border() that applies a cut-out effect for borders. Users can add text and images to hexagon shapes with a sequence of commands. The example demonstrates hex creation for the {gex} logo with image manipulation using {magick} and showcases loops for multiple images and text effects.
Go to Resource
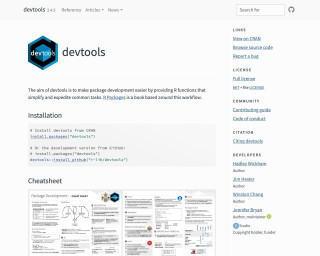
devtools
devtools is an R package that aims to make package development easier by providing functions that simplify and expedite common tasks. It includes functions for loading code, updating documentation, running tests, building and installing packages, checking and releasing packages, and more. It is widely used for R package development and there are several resources available to learn more about package development using devtools.
Go to Resource
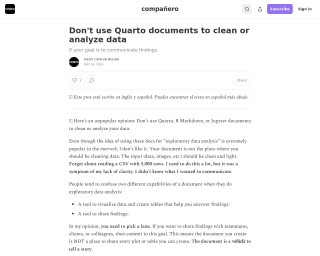
Don't use Quarto documents to clean or analyze data
This content advocates against using Quarto, R Markdown, or Jupyter for data cleaning and analysis, emphasizing that these platforms should be used for communication rather than exploratory tasks. Diego Catalan Molina advises that data inputs should be clean before being loaded into documents which should serve as a vehicle to tell a story. He suggests creating engaging outlines focused on findings' importance and using these documents exclusively to share results, not every plot or table during the exploratory phase of data analysis.
Go to Resource
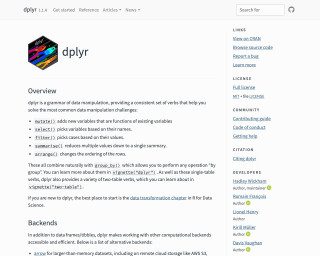
dplyr
dplyr is a package in R that provides a grammar of data manipulation. It offers a consistent set of verbs to solve common data manipulation challenges, such as adding new variables, selecting variables, filtering cases, summarizing data, and arranging rows. It also provides support for working with different computational backends, including arrow, dtplyr, dbplyr, duckplyr, duckdb, and sparklyr. The package can be installed as part of the tidyverse or separately.
Go to Resource