Resources
This carefully curated collection of resources will help you find packages and learning resources to help you on your R journey.
CRAN - Package ggquiver
An extension of 'ggplot2' to provide quiver plots to visualise vector fields.
Go to Resource
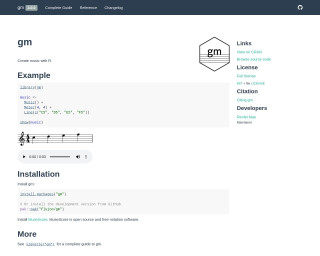
Create Music with R
The 'gm' package in R enables users to create music by programmatically defining musical elements such as meter and musical lines. It offers an ease of composing music within R. Using functions like 'Music()', 'Meter()', and 'Line()', users can construct and visualize melodies. The package is easily installable from CRAN or GitHub for the development version. Integration with MuseScore, a free notation software, allows for a seamless music notation experience. The 'gm' package is open-source under the MIT license, with detailed documentation available in its vignette.
Go to Resource
Create paint by numbers images
The 'paintr' GitHub repository hosts an R package for creating paint-by-numbers images. It leverages the 'magick' package for image processing and color picking, and 'sf' and 'rmapshaper' packages for handling image polygons. Users can apply noise reduction, smoothing, and polygon simplification to adjust the image feel. It also allows for custom color palettes. The repository contains examples, including usage with Hadley Wickham's photo, demonstrating how to generate a paint-by-numbers result and apply different palettes for the desired artistic effect.
Go to Resource
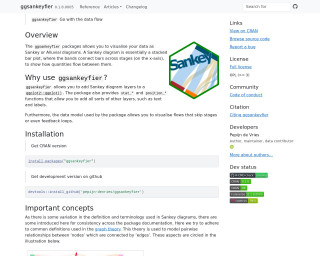
Create Sankey and Alluvial Diagrams Using ggplot2 • ggsankeyfier
The ggsankeyfier package enhances ggplot2 by allowing the creation of Sankey and Alluvial diagrams, which are types of data visualization that depict the flow of quantities through stages or categories. It provides specialized functions to handle the complex layout of these diagrams, including the ability to model skipped stages or feedback loops. The package defines its own terms for consistency and offers a thesaurus for commonly used Sankey terminology. It can be installed from CRAN or GitHub and is integrated into the ggplot2 workflow, requiring structured data for plotting.
Go to Resource
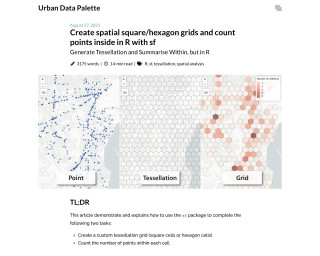
Create spatial square/hexagon grids and count points inside in R with sf | Urban Data Palette
Create spatial square/hexagon grids and count points inside in R with sf
Go to Resource
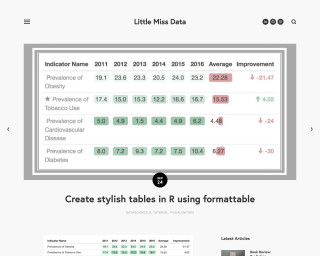
Create stylish tables in R using formattable
Create stylish tables in R using formattable
Go to Resource
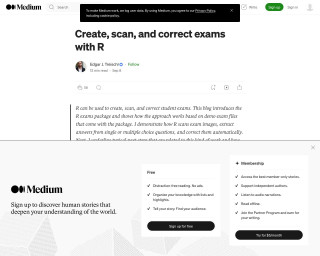
Create, scan, and correct exams with R | by Edgar J. Treischl | Medium
This blog introduces the R exams package and shows how to create, scan, and correct student exams using R. It demonstrates how R scans exam images, extracts answers from single or multiple choice questions, and corrects them automatically. It also highlights the next steps and how they are implemented in R, as well as how to create your own exam questions. The package helps automate the entire process of generating, scanning, and assessing exams.
Go to Resource
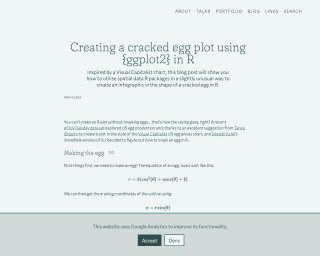
Creating a cracked egg plot using {ggplot2} in R | Nicola Rennie
Creating a cracked egg plot using {ggplot2} in R
Go to Resource
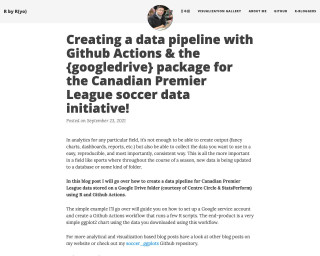
Creating a data pipeline with Github Actions & the {googledrive} package for the Canadian Premier League soccer data initiative!
Creating a data pipeline with Github Actions & the {googledrive} package for the Canadian Premier League soccer data initiative!
Go to Resource
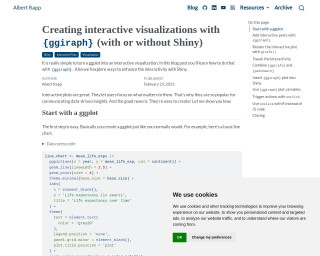
Creating interactive visualizations with {ggiraph} (with or without Shiny)
Albert Rapp's blog post explains how to create interactive visualizations using the {ggiraph} package with or without Shiny in the R programming environment. It guides readers through the process of turning a ggplot into an interactive plot where users can focus on details that interest them. The tutorial includes data preparation with 'dplyr' and 'ggplot2', and demonstrates how to add interactivity to both lines and points in a chart. The post covers the use of 'geom_point_interactive', 'geom_line_interactive', and 'girafe()' function for rendering, and customization options for hover effects and plot sizing.
Go to Resource
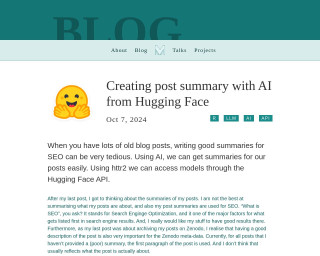
Creating post summary with AI from Hugging Face
Dr. Mowinckel discusses the use of Hugging Face's AI to automate the creation of SEO-friendly summaries for blog posts, which is both time-efficient and enhances discoverability. The tutorial encompasses acquiring the Hugging Face API key, structuring requests, and handling responses with the R package httr2. It also highlights the importance of concise summaries for both SEO and repository metadata, and details the workflow from content preparation to writing summaries to a file. Hugging Face’s community efforts and accessible APIs are commended for their ease of use and functionalities.
Go to Resource
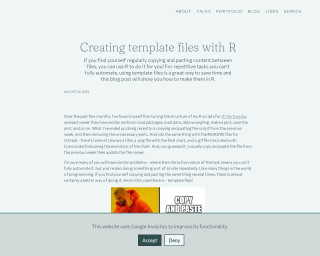
Creating template files with R
Nicola Rennie's blog post teaches readers how to save time when dealing with repetitive tasks by creating template files with R. The post explains fine-tuning R scripts for tasks like #TidyTuesday, where similar sections are involved each week. Instead of copying and pasting scripts and GitHub README files weekly and updating parts manually, Rennie introduces a method for generating template files and folders based on a date argument. This process includes creating organized directories and template files, replete with content placeholders, which can then be customized for the specific week's work.
Go to Resource