Resources
This carefully curated collection of resources will help you find packages and learning resources to help you on your R journey.

Bluesky conversation analysis with local and frontier LLMs with R/Tidyverse
This content details the author's exploration of bluesky conversation analysis using R and the Tidyverse suite, specifically focusing on local and frontier large language models (LLMs). The author leverages R packages atrrr, ellmer in the tidyverse, mlverse/mall, and interfaces with models such as Claude & Ollama. Processes include summarizing posts, performing sentiment analysis, and posting summaries to GitHub via the gistr R package. Techniques include data retrieval, text analysis, and summarization, showcasing how open models can provide insights into community discussions on Bluesky, particularly within the R community's use of the #Rstats hashtag.
Go to Resource
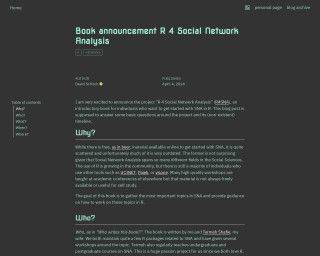
Book announcement R 4 Social Network Analysis
The blog post 'R 4 Social Network Analysis' announces an in-progress book aimed at introducing social network analysis (SNA) in R to practitioners. Authored by schochastics and Termeh Shafie, both of whom have extensive experience in SNA and R package development, the book will cover key SNA topics and demonstrate how to manage network analytical tasks in R. It addresses the scarcity and dispersal of current SNA learning materials and seeks to provide a central, up-to-date source. The book's practical focus is on applying R tools rather than delving into theory, making it suitable for those ready to apply SNA techniques. It is openly written on GitHub using quarto, inviting community feedback through issues.
Go to Resource

brand.yml
The _brand.yml file allows for unified branding across various outputs by setting company brand guidelines in a YAML file. This file can be integrated with tools like Quarto and Python's Shiny to automatically apply brand themes to reports, dashboards, and presentations, ensuring a consistent brand identity in data science products. Support for _brand.yml is available in several formats and libraries, enabling easy theming with company logos, colors, and typography across different platforms. Examples and user stories illustrate its practical applications in data science workflows.
Go to Resource
Branding and automating your work with R Markdown
This video is about branding and automating work with R Markdown. It discusses how a team of data scientists uses advanced features in RStudio to brand reports and presentations for clients. The speaker highlights lessons learned in areas like version control and automation, including how a few lines of code allowed them to create a specialized report on crime for every county in Utah.
Go to Resource
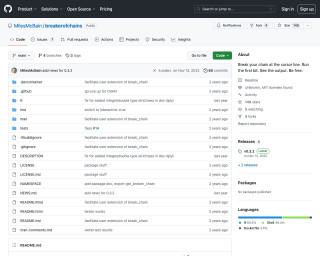
breakerofchains
Break your chain at the cursor line. Run the first bit. See the output. Be free.
Go to Resource
bs4Dash
bs4Dash is a Bootstrap 4 version of shinydashboard, a package for creating dashboards with Shiny in R. This article provides information on how to upgrade from shinydashboard to bs4Dash.
Go to Resource

Build Advanced Charts in R
The LinkedIn Learning course 'Build Advanced Charts in R' by Rita Giordano is an advanced-level data visualization course. Over 1 hour and 43 minutes, students delve into creating sophisticated charts including lollipop plots, sparklines, dot charts, and slope charts. The course covers creating theme functions, combining plots, and ensuring accessibility with colorblind-friendly palettes and dyslexia-friendly fonts. Participants will learn when to use advanced charts, how to apply accessibility principles, and how to build a simple infographic. A downloadable certificate of completion enhances professional profiles, demonstrating data visualization proficiency in R.
Go to Resource
Build Advanced Charts in R Online Class | LinkedIn Learning, formerly Lynda.com
This online class on LinkedIn Learning (formerly Lynda.com) teaches users how to build advanced charts in R for data visualization. The course covers topics such as lollipop plots, sparklines, dot charts, slope charts, and chord diagrams. It also includes information on creating a theme function, combining multiple plots, and addressing accessibility and annotations. The instructor, Rita Giordano, is a data visualization consultant and LinkedIn Instructor.
Go to Resource

Building a Linkedin data visualisation template with Quarto and Typst
Aaron Schiff shares a method for sharing data visualizations on Linkedin using Quarto and Typst. He created a template that allows for the production of nicely formatted PDFs to circumvent Linkedin's subpar image handling. The template includes a topic heading, summary text, a ggplot chart, data source citation, optional two-column text, and a footer. Additionally, Schiff explains the synergy of Quarto, a publishing system, and Typst, a layout framework, to streamline the production of visually appealing PDFs. He provides guidance on creating a Quarto Typst template and how to use it with example code and the configuration process.
Go to Resource