Resources
This carefully curated collection of resources will help you find packages and learning resources to help you on your R journey.
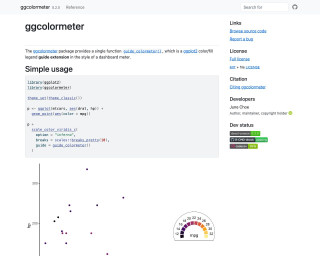
Colormeter Guide Extension • ggcolormeter
The ggcolormeter package provides a single function guide_colormeter() which is a ggplot2 color/fill legend guide extension in the style of a dashboard meter.
Go to Resource
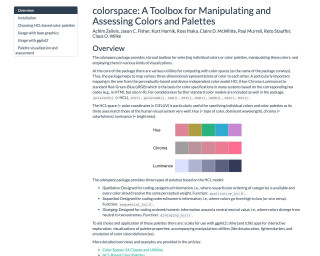
colorspace: A Toolbox for Manipulating and Assessing Colors and Palettes
colorspace is a toolbox for manipulating and assessing colors and palettes in the R language. It provides utilities for computing with color spaces, such as converting between different color models. The package also includes predefined color palettes and functions for creating customized palettes. It can be used for visualizations and choosing colors in data analysis and graphic design.
Go to Resource
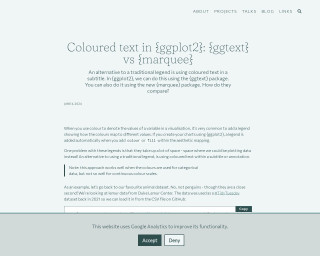
Coloured text in {ggplot2}: {ggtext} vs {marquee}
This content compares two R packages, {ggtext} and {marquee}, which allow users to add colored text to {ggplot2} visualizations as an alternative to a traditional legend. It discusses the suitability of this approach for categorical data and provides examples using lemur data from Duke Lemar Center. The tutorial includes data wrangling with {dplyr} and creating a scatter plot in {ggplot2}, as well as describing the use of HTML and CSS for text formatting in the {ggtext} package.
Go to Resource
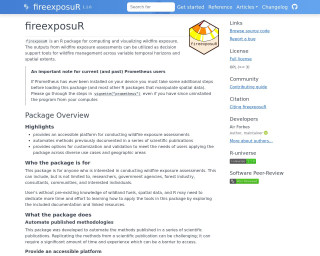
Compute and Visualize Wildfire Exposure • fireexposuR
fireexposuR is an R package designed for computing and visualizing wildfire exposure with a focus on aiding wildfire management. It automates established methodologies, offers customization for various use cases and geographies, and enables output visualization. Users from varied sectors like research, government, and forestry can benefit, but a solid understanding of wildland fuels, spatial data, and R is recommended. The package ensures accessibility and encourages users to familiarize themselves with the underpinning scientific theories for effective use. It doesn't simplify the complexities of theory, data preparation, or parameter decision-making intrinsic to wildfire exposure assessments.
Go to Resource
Computer vision with LLMs in R
The Posit blog post details the application of Computer Vision with Language Model (LLM) techniques using R. Authored by Frank Hull, a Director of Data Science & Analytics, it delves into the role of AI in the energy sector, particularly in risk understanding and uncertainty quantification. The article reflects Hull's extensive experience and introduces how Posit is enhancing data science workflows with AI. Readers are invited to subscribe for updates on Posit's latest AI integrations, features, and releases in the rapidly evolving field of data science.
Go to Resource
Constructing a Baseball Savant Graph
This content describes a workshop on creating a Baseball Savant graph and replicating its unique graphic style using Gerrit Cole's pitch data as an example. It includes a step-by-step guide on analyzing baseball data using R, from reading Retrosheet data, computing mean runs from game states, graphing expected runs, and finding leaders in total runs value. It also demonstrates how to reproduce the Movement Profile graph from Baseball Savant by manipulating and visualizing pitch movement data. The material, available on GitHub, is designed for those interested in sabermetrics and data visualization in sports analytics.
Go to Resource
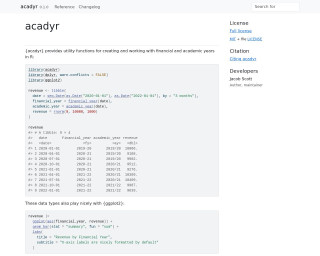
Convenience Functions for Working With Non-Calendar Years in R • acadyr
acadyr is an R package that simplifies the process of working with financial and academic years, which do not follow standard calendar cycles. It provides utility functions to create and manipulate these non-standard year types in R, such as financial_year and academic_year, which help in determining the year based on any given date. The package integrates smoothly with dplyr and ggplot2, and includes a vignette with examples of typical use cases, such as generating summary bar charts of revenues by financial year. While not available from CRAN, acadyr can be installed directly from GitHub.
Go to Resource
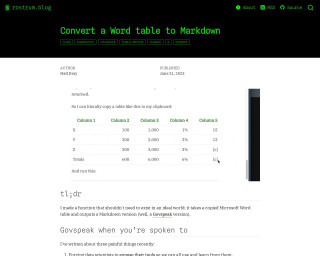
Convert a Word table to Markdown
The blog post describes a function created by the author to convert Microsoft Word tables into Govspeak Markdown, which is needed for publishing HTML files on GOV.UK. This process is typically tedious and demands attention to specific Govspeak features such as row labels and totals columns. The author introduces an R package named {wordup} that includes the function table_to_govspeak(), which handles input, guesses data types, and applies extra styles to the table conversion. It streamlines moving content from Word to Govspeak, which can be further facilitated by copying tables to the clipboard.
Go to Resource
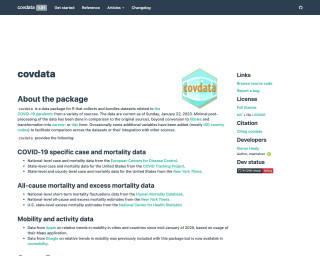
covdata
covdata is a data package for R that collects and bundles datasets related to the COVID-19 pandemic from a variety of sources.
Go to Resource
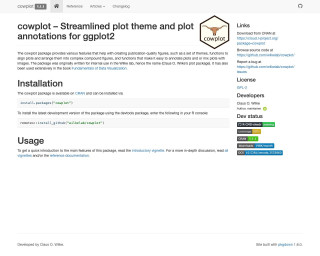
cowplot
The cowplot package provides various features that help with creating publication-quality figures, such as a set of themes, functions to align plots and arrange them into complex compound figures, and functions that make it easy to annotate plots and or mix plots with images.
Go to Resource