Resources
This carefully curated collection of resources will help you find packages and learning resources to help you on your R journey.
Creating Polished, Branded Documents with Quarto
Isabella Velásquez from Posit delivers a comprehensive R/Pharma workshop on creating polished, professionally branded documents using Quarto. The talk covers Quarto’s key outputs—documents, presentations, websites, dashboards, and PDFs—and focuses heavily on theming and branding, including the use of brand.yml to define and apply consistent visual identities (colors, fonts, logos) across all output formats from a single configuration file.
Go to Resource
Creating post summary with AI from Hugging Face
Dr. Mowinckel discusses the use of Hugging Face's AI to automate the creation of SEO-friendly summaries for blog posts, which is both time-efficient and enhances discoverability. The tutorial encompasses acquiring the Hugging Face API key, structuring requests, and handling responses with the R package httr2. It also highlights the importance of concise summaries for both SEO and repository metadata, and details the workflow from content preparation to writing summaries to a file. Hugging Face’s community efforts and accessible APIs are commended for their ease of use and functionalities.
Go to Resource
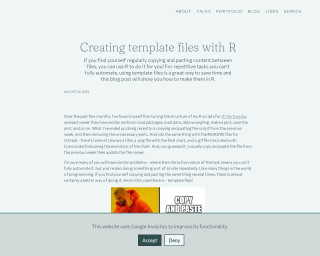
Creating template files with R
Nicola Rennie's blog post teaches readers how to save time when dealing with repetitive tasks by creating template files with R. The post explains fine-tuning R scripts for tasks like #TidyTuesday, where similar sections are involved each week. Instead of copying and pasting scripts and GitHub README files weekly and updating parts manually, Rennie introduces a method for generating template files and folders based on a date argument. This process includes creating organized directories and template files, replete with content placeholders, which can then be customized for the specific week's work.
Go to Resource
Creating template files with R | Nicola Rennie
Learn how to create template files in R to automate repetitive tasks.
Go to Resource
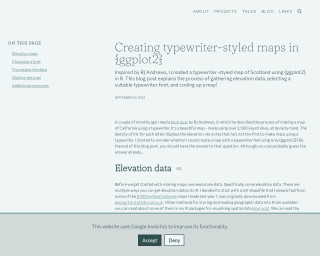
Creating typewriter-styled maps in {ggplot2}
This blog post by Nicola Rennie details how to create a typewriter-styled map of Scotland using the {ggplot2} package in R. The process involves gathering elevation data from a shapefile and using the {elevatr} package for accessing the elevation API. Selecting a suitable typewriter font with {sysfonts} and {showtext}, Rennie demonstrates how to represent different elevation levels with various letters in a monospace font. The final output replicates the appearance of a map created with a typewriter, reminiscent of RJ Andrews' handcrafted map of California using over 2,500 keystrokes.
Go to Resource
Creating typewriter-styled maps in {ggplot2} | Nicola Rennie
Creating typewriter-styled maps in ggplot2. This blog post explains the process of gathering elevation data, selecting a suitable typewriter font, and coding up a map.
Go to Resource
Creating your personal website using Quarto
This document by Sam Shanny-Csik offers an introductory guide to creating personal websites using Quarto. It covers the basics of Quarto as a multipurpose publishing system built on Pandoc and how it integrates with languages like R, Python, and Julia for dynamic content creation. The tutorial explains the similarities and differences between RMarkdown and Quarto Markdown files, provides tips for code chunk execution, and guides readers through deploying their Quarto website using GitHub Pages. Additionally, it encourages exploring further resources on Quarto and the possibility of using other R-based tools or HTML templates for website creation.
Go to Resource
Data Cleaning Flipbook
A flipbook with examples of data cleaning using R and the tidyverse package
Go to Resource
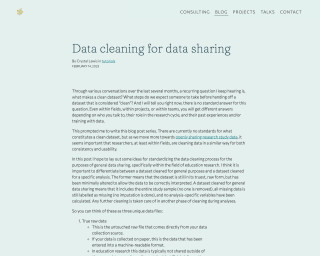
Data cleaning for data sharing | Crystal Lewis
Data cleaning for data sharing by Crystal Lewis in tutorials February 14, 2023.
Go to Resource
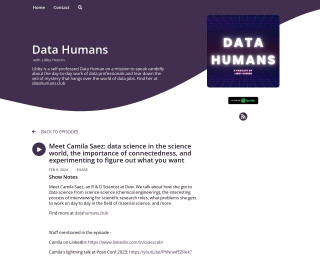
Data Humans Podcast
Libby Heeren is a self-professed Data Human on a mission to speak candidly about the day-to-day work of data professionals and tear down the veil of mystery that hangs over the world of data jobs. Find her at datahumans.club
Go to Resource
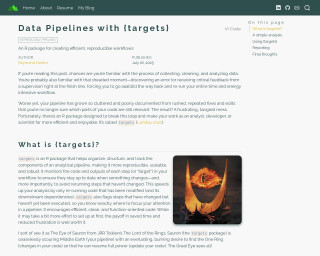
Data Pipelines with {targets}
This content introduces the 'targets' R package, designed to assist in creating reproducible and efficient data pipelines. 'targets' tracks each component of an analytical pipeline, updating steps only when changes occur and avoiding redundant computations. It facilitates clean, function-oriented code that significantly reduces frustration and time spent on re-running analyses due to errors or alterations in the code. The post includes a simple analysis example using the 'palmerpenguins' dataset, demonstrating how 'targets' can streamline the workflow. The analogy to The Eye of Sauron exemplifies its vigilant tracking capability.
Go to Resource
Data Science for the Biomedical Sciences
Data Science for the Biomedical Sciences is a book that provides an introduction to data science concepts and tools specifically tailored for the biomedical sciences. It covers topics such as spreadsheets, R and RStudio, data loading, descriptive calculations, data cleaning, visualization, analysis, working with multiple datasets, APIs, functions, survival analysis, machine learning, and more.
Go to Resource