Statistical Tests
This lesson is called Statistical Tests, part of the R in 3 Months (Fall 2022) course. This lesson is called Statistical Tests, part of the R in 3 Months (Fall 2022) course.
Transcript
Click on the transcript to go to that point in the video. Please note that transcripts are auto generated and may contain minor inaccuracies.
Loading transcript...
In the video below Charlie walks through everything you need to know about using the 31 different statistical test functions built into R.
These built in functions come from the {stats} package - part of base R. For that reason they're designed to be given vectors instead of data.frame. Here's the code that Charlie uses in the video to perform a t.test on the penguins dataset
library(tidyverse)
library(palmerpenguins)

penguins_adelie <- penguins %>%
  filter(species == "Adelie")

penguins_chinstrap <- penguins %>%
  filter(species == "Chinstrap")

t.test(penguins_adelie$body_mass_g, penguins_chinstrap$body_mass_g)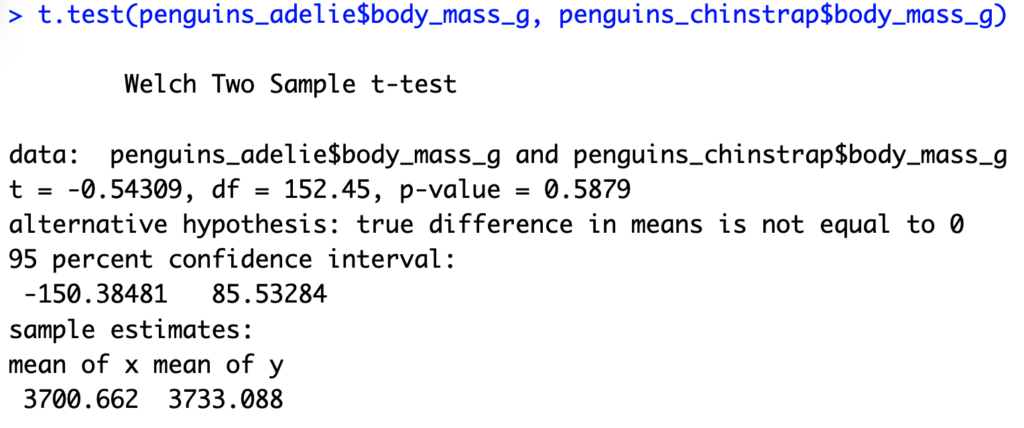
Unfortunately, this output is unstructured and difficult to work with. But the tidyverse has our back!We can use the {broom} package to tidy the results into a data.frame
library(broom)
t.test(penguins_adelie$body_mass_g, penguins_chinstrap$body_mass_g) %>%
  tidy()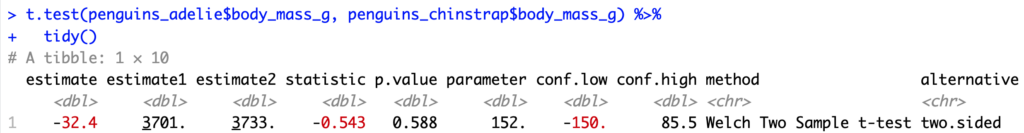
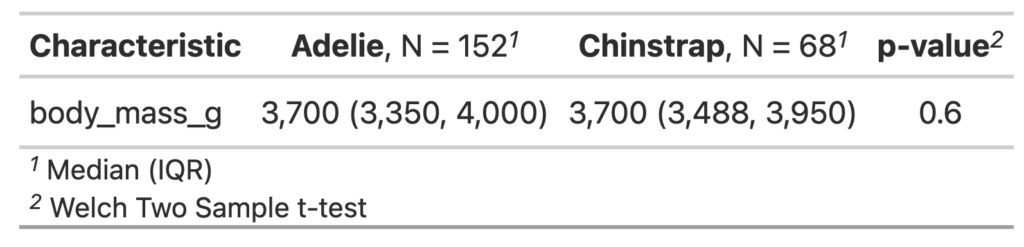
{gtsummary}
Charlie also demonstrates how the {gtsummary} package allows you to create attractive statistical summary tables within which you can perform statistical tests:
library(gtsummary)

penguins %>%
  select(species, body_mass_g) %>%
  filter(species %in% c("Chinstrap", "Adelie")) %>%
  mutate(species = fct_drop(species)) %>%
  tbl_summary(by = "species", missing = "no") %>%
  add_p(
    test = everything() ~ "t.test"
  )
Have any questions? Put them below and we will help you out!
Course Content
142 Lessons
You need to be signed-in to comment on this post. Login.