Resources
This carefully curated collection of resources will help you find packages and learning resources to help you on your R journey.
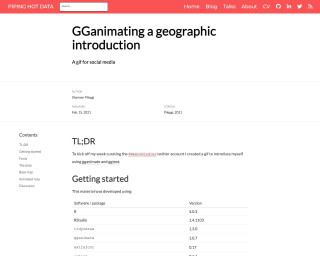
PIPING HOT DATA: GGanimating a geographic introduction
GGanimating a geographic introduction using gganimate and ggtext
Go to Resource
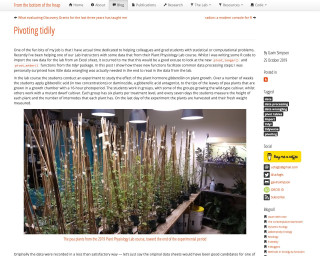
Pivoting tidily
This post discusses the new pivot_longer() and pivot_wider() functions from the tidyr package in R. It demonstrates how these functions can facilitate common data processing steps and reduce the need for extensive data wrangling. The post uses an example from a Plant Physiology Lab course to illustrate the use of these functions.
Go to Resource

Plotting Age Pyramids with ggplot
Jose M Sallan's blog post titled 'Plotting Age Pyramids with ggplot' outlines the process of creating age pyramids using R and ggplot2. Age pyramids display population distributions by age groups and sex, typically with males on the left and females on the right. The article guides readers through formatting and adjusting data using tidyverse functions, and demonstrates how to plot these pyramids by reading data from a CSV file, cleaning column names, filtering, selecting, and mutating data to reflect proper age groups and percentages. This tutorial caters to those interested in data visualization and demographic analysis.
Go to Resource
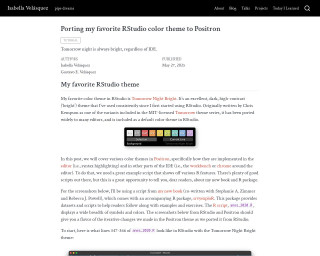
Porting my favorite RStudio color theme to Positron
This post details the process of adapting the popular Tomorrow Night Bright RStudio theme for use in Positron. The authors discuss their personal journey with the theme, its origins, and how it was ported to other editors. By navigating through RStudio's source code, they found the color palette for rainbow parentheses, which was uniquely developed in R. The post also explores the customizability offered by Positron's Open VSX Registry extension mechanism. The authors introduce 'Tomorrow Night Bright (R Classic),' a new theme extension available for Positron and VS Code, sharing screenshots and experiences from the porting process.
Go to Resource
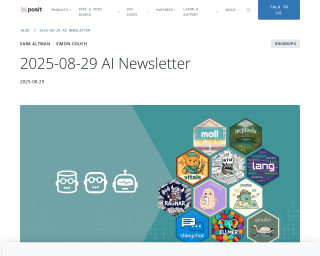
Posit AI Newsletter
Posit's blog for August 29, 2025, announces the publication of an AI newsletter curated by Sara Altman and Simon Couch, previously internal, now available biweekly. The newsletter discusses significant AI developments including environmental reports on LLMs by Mistral AI and Google, and introduces Positron Assistant and Databot for R/Python coding and data analysis. It raises awareness about the energy demands of AI during training and inference stages, emphasizes responsible AI tool usage, and shares external insights and resources on AI advancements and security vulnerabilities with the data science community.
Go to Resource
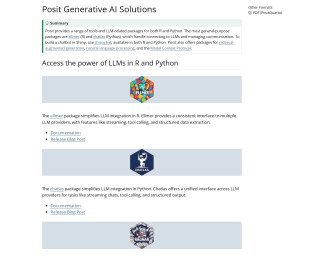
Posit Generative AI Solutions
Posit GenAI Solutions offers versatile packages for integrating LLMs into R and Python. It features ellmer and chatlas for LLM communication, shinychat for chatbots in Shiny, and ragnar for Retrieval-Augmented Generation. Additional tools include querychat for natural language data querying, chores for automating coding tasks, and gander for in-line chat integration in data science workflows. The mall package efficiently applies LLM predictions to data frames, while lang translates documentation. Positron Assistant and GitHub Copilot enhance IDEs with AI. Packages like otel provide observability via OpenTelemetry, and mcptools implements the MCP for R sessions.
Go to Resource
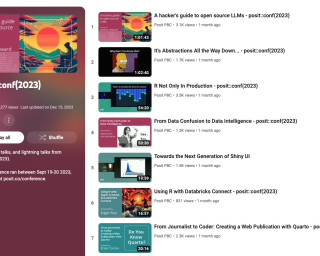
posit::conf(2023)
All keynotes, talks, and lightning talks from posit::conf(2023). Posit Conference ran between Sept 19-20 2023, Learn more at posit.co/conference.
Go to Resource
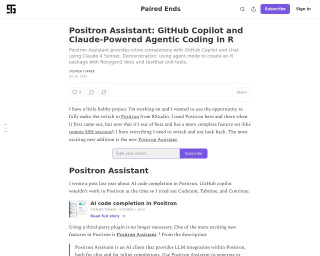
Positron Assistant: GitHub Copilot and Claude-Powered Agentic Coding in R
Positron Assistant is a tool that integrates with GitHub Copilot and Anthropic Claude to offer advanced code completion and interaction for R programming. It provides a seamless experience for users switching from RStudio by offering a comprehensive feature set, including remote SSH sessions. With Positron Assistant, users can generate or refactor code, ask questions, get debugging assistance, and receive project guidance within the Positron environment. It simplifies the process of creating R packages, documenting with Roxygen2, and writing unit tests with testthat, demonstrating its capability through agent mode.
Go to Resource

Positron IDE - A new IDE for data science
Dr. Mowinckel reviews Positron IDE, a new data science-oriented IDE that's evolved from Visual Studio Code. The blog explores Positron's compatibility with R and discusses its features, such as integration with Rmd, Hugo websites, and RStudio projects. It analyzes the ease of transitioning from other IDEs, like RStudio, highlighting Positron's customizability, multi-language support, and environment setup. Comparisons are made with other IDEs, underscoring Positron's suitability for polyglot programmers and its potential as a preferred tool. The writer reflects on the learning curve and extensibility, giving insights into making Positron an effective data science environment.
Go to Resource