Resources
This carefully curated collection of resources will help you find packages and learning resources to help you on your R journey.
R Graph Gallery
The R Graph Gallery is a collection of charts made with the R programming language. It features a wide range of chart types and provides reproducible code and explanations for each example. The gallery focuses on the tidyverse and ggplot2 packages. It also showcases the best R charts created by leading creators in the field.
Go to Resource
R Graphics Cookbook
The R Graphics Cookbook is a practical guide that provides more than 150 recipes to help you create high-quality graphics in R. This second edition of the book covers various topics such as data exploration, bar graphs, line graphs, scatter plots, and more. Each recipe provides a problem, a solution, and a discussion of the code, allowing you to learn and understand the concepts behind creating effective graphics.
Go to Resource
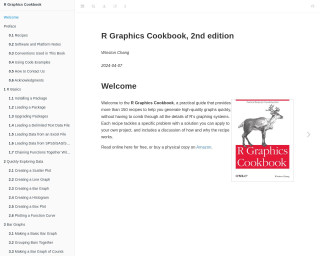
R Graphics Cookbook, 2nd edition
The 'R Graphics Cookbook, 2nd edition' serves as a practical guide that offers a wide array of graphical examples using R. It encompasses a collection of recipes addressing common tasks and problems for creating graphics in R. The book is designed to help readers quickly find and implement solutions for various data visualization scenarios, covering topics from basic R installation, loading packages, and importing data, to generating different types of plots such as bar graphs, line graphs, and scatter plots. Essential for both beginners and experienced R users, the cookbook-style format makes it an accessible and valuable resource for effective data visualization.
Go to Resource
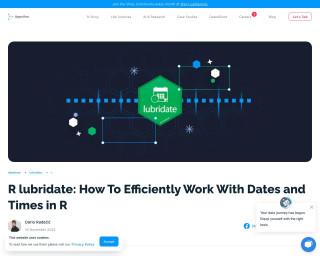
R lubridate: How To Efficiently Work With Dates and Times in R - R programming
Learn how to efficiently work with dates and times in R using the lubridate package. This tutorial provides 15 useful examples to help you master lubridate.
Go to Resource
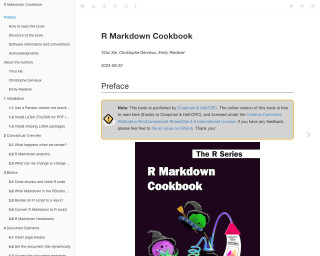
R Markdown Cookbook
R Markdown Cookbook is a comprehensive guide that provides tips and tricks for effectively using R Markdown to create dynamic reports and documents. The book covers various topics, including installation, conceptual overview, basics, document elements, formatting, LaTeX output, HTML output, Word output, multiple output formats, and tables. It also includes code examples and explanations to illustrate the concepts.
Go to Resource
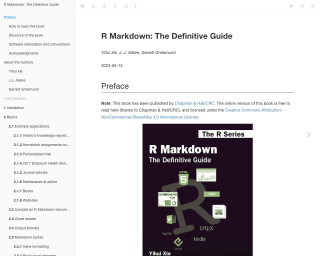
R Markdown: The Definitive Guide
R Markdown: The Definitive Guide is a comprehensive guide to using R Markdown for creating dynamic reports, presentations, and dashboards.
Go to Resource
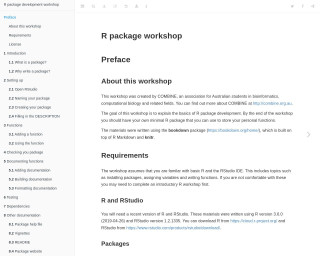
R package workshop
This content outlines the structure and components of an R package development workshop. It includes topics like setting up an environment, writing and documenting functions, version control, and publishing to repositories like CRAN and GitHub. The workshop is aimed at individuals with basic R knowledge and focuses on practical aspects, such as naming packages, creating DESCRIPTION files, managing dependencies, and integrating version control systems. Advanced topics include dataset inclusion and language integration. It is intended for a bioinformatics audience by COMBINE, utilizing bookdown for writing and RStudio for development.
Go to Resource
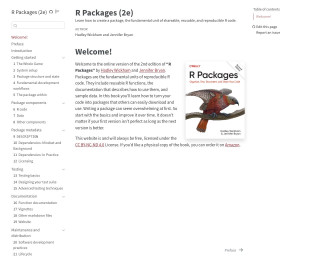
R Packages
Learn how to create a package, the fundamental unit of shareable, reusable, and reproducible R code.
Go to Resource
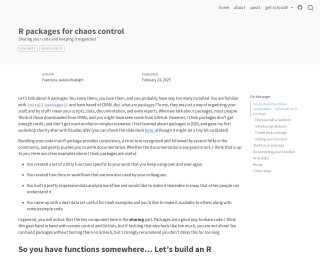
R packages for chaos control
This content covers R packages and their often underappreciated role in organizing scripts, data, documentation, and reports. R packages are discussed beyond their common association with CRAN, including their usefulness in simpler scenarios. The piece highlights the importance of R packages for consistency, structure, and promoting documentation. Practical applications of R packages, such as creating utility functions and sharing code, are emphasized, especially for collaboration. Version control and GitHub are mentioned as complementary tools. Building an R package is encouraged, with references to resources and a minimal guide to get started, suggesting a less intimidating approach for newcomers.
Go to Resource
R Primers
R Primers offer updated RStudio/Posit educational content, now utilizing Quarto and webR. Originally developed by RStudio/Posit Education Team, these open-source tutorials help users learn R programming, deriving content from the book 'R for Data Science'. They are licensed under the CC BY-SA 4.0, ensuring wide accessibility for learners to improve their data science skills with R.
Go to Resource
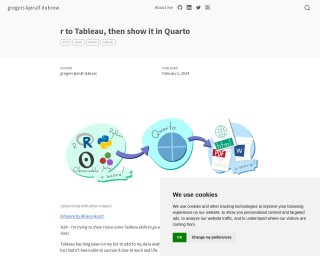
R to Tableau, then show it in Quarto
This content outlines Gregers Kjerulf Dubrow's journey to integrating R with Tableau and showcasing the synergy through a Quarto blog post. Dubrow seeks to enhance his employment prospects by demonstrating his proficiency in Tableau alongside his R skills. Utilizing the free version of Tableau Public and without previous knowledge of data connection and cleaning in Tableau, he adopts a workflow that features using r for sourcing and cleaning the data, followed by visualization in Tableau, and finally embedding the Tableau visualization in a Quarto blog post. This practical application involves a data analysis project of the English Premier League's 2022-23 season with the worldfootballr package, including the creation of a parametrized user-choice analysis dashboard.
Go to Resource
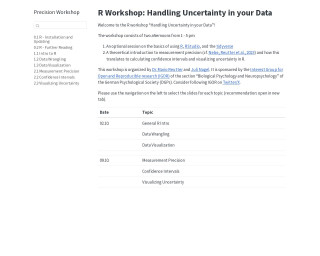
R Workshop: Handling Uncertainty in your Data
This R Workshop titled 'Handling Uncertainty in your Data' is designed to educate participants on managing data uncertainty. Organized by Dr. Mario Reutter and Juli Nagel, and sponsored by IGOR, the workshop spans two afternoons with sessions on R basics, measurement precision theory, and practical techniques for computing confidence intervals and uncertainty visualization in R. Additionally, it provides a general intro to R, data wrangling, and visualization, with a spotlight on translating measurement precision into visual representations.
Go to Resource