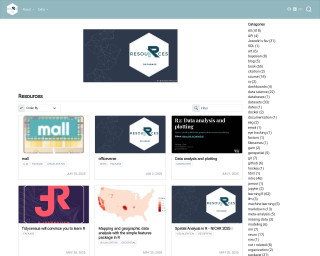
Resources
This carefully curated collection of resources will help you find packages and learning resources to help you on your R journey.
Rebecca Barter - Learn to purrr
Learn about the purrr package in R, which provides map functions for iteration and manipulating lists.
Go to Resource
Recreate a real-world, complex dataviz with R & ggplot - YouTube
Recreate a real-world, complex dataviz with R & ggplot - YouTube
Go to Resource
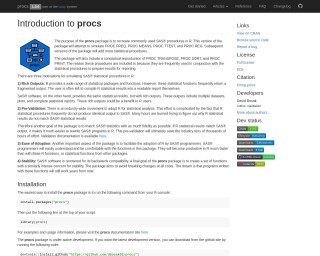
Recreate Some SAS® Procedures in R Using {procs}
The R package 'procs' replicates commonly used SAS procedures, targeting functions like PROC FREQ, PROC MEANS, PROC TTEST, and PROC REG. It simplifies the transition for SAS users to R by providing familiar functionality and outputs. This includes rich reporting outputs similar to SAS, pre-validated results to ensure fidelity with SAS outputs, ease of adoption for existing SAS users, and stability to maintain backward compatibility. The package includes data manipulation functions and aims to help save time in statistical results comparison and reporting.
Go to Resource
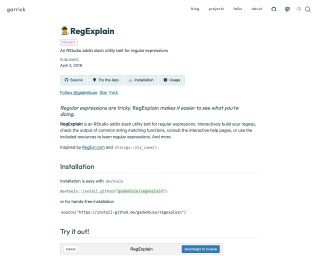
RegExplain
🕵️♂️ RegExplain is an RStudio addin and utility belt for regular expressions. It allows users to interactively build and test regular expressions, check the output of string matching functions, and consult help pages and resources.
Go to Resource
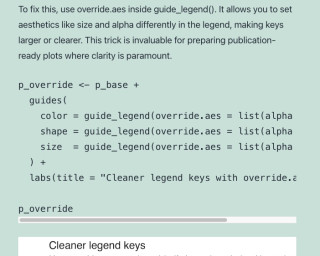
Remove or Hide Legends in ggplot2 – Theme, Guides, Scales & Tips
This practical tutorial demonstrates how to remove or hide legends in {ggplot2} plots, covering both complete legend removal and selective legend management for plots with multiple layers. The post shows various approaches using theme settings, the guides() function, and scale modifications. It’s a handy reference for those common situations where you need fine-grained control over which legends to display, especially useful when working with complex multi-layered visualizations.
Go to Resource

Render media to different formats • renderthis
The package 'renderthis' (formerly 'xaringanBuilder') enables users to render R Markdown and Quarto documents into various formats like HTML, PDF, PNG, GIF, PPTX, and MP4. It specifically caters to xaringan or revealjs slide presentations and includes a 'social' output optimized for sharing on social media. Installation requires dependencies and a local Google Chrome browser. It simplifies rendering with functions prefixed by to_*() requiring a source file path. Additional dependencies are needed for certain formats, with instructions provided for each case. The package supports an efficient workflow for preparing presentations for diverse sharing and publication purposes.
Go to Resource
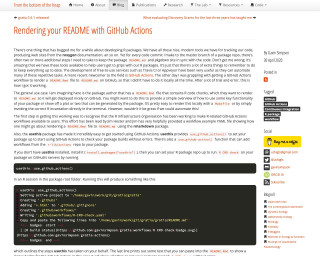
Rendering your README with GitHub Actions
This tutorial explains how to use GitHub Actions to automatically render your README.Rmd file to README.md on GitHub.
Go to Resource
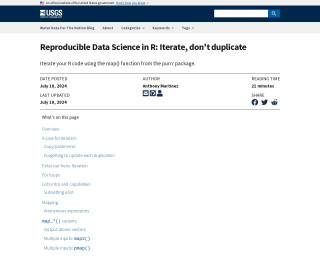
Reproducible Data Science in R: Iterate, don't duplicate
This blog post on the Water Data For The Nation Blog guides novice to intermediate R users on how to achieve reproducible data science by replacing code duplication with iteration techniques. It introduces the 'map()' function from the purrr package, explaining its advantages over copy/paste approaches and for loops. The post covers mapping techniques, the usage of lists, various map_*() function variants, and working with multiple inputs or no outputs. It is part of a series aimed at building functional programming skills and creating efficient data workflows with the targets R package.
Go to Resource
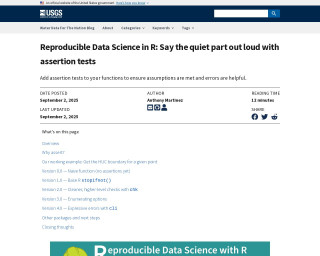
Reproducible Data Science in R: Say the quiet part out loud with assertion tests
This blog post explores the role of assertion tests in reproducible data science when using R. The author, Anthony Martinez, walks through a tutorial on improving the robustness of R functions with assertions, beginning with basic checks and evolving to more expressive error messages. The post, intended for novice and intermediate R users, is part of a series on functional programming and reproducibility using the targets package. It highlights the importance of failing early with clear messages in multi-person projects and offers examples using the geoconnex.us database to retrieve Hydrologic Unit boundary polygons.
Go to Resource
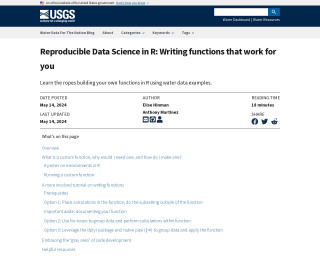
Reproducible Data Science in R: Writing functions that work for you
This blog post from the Water Data For The Nation Blog guides readers on crafting custom functions in R for reproducible data science, particularly with water-related data. Starting from the basics, it emphasizes the benefits like consistency, error reduction, and code shortening by avoiding repeated tasks. The post covers function essentials and environments in R, providing a step-by-step tutorial using the Water Quality Portal data. It prepares readers for advanced function usage in R, targeting those with basic programming experience aiming to advance their skills.
Go to Resource
resouRces
This content encompasses a comprehensive list of R-related educational materials, packages, tutorials, and datasets with projected dates ranging up to the year 2025. It includes various titles that focus on learning R programming, data analysis, data visualization, geospatial mapping, and statistical methods. Significant emphasis is placed on resources for learning R, such as introductions to R, books, courses, and video tutorials. Additionally, specific packages for data wrangling, statistical modeling, and visualization are mentioned, indicating the evolution and specialization of R's ecosystem to cater to diverse data science needs.
Go to Resource
RMarkdown
The rmarkdown package helps you create dynamic analysis documents that combine code, rendered output (such as figures), and prose. It allows you to do data science interactively within the RStudio IDE, reproduce your analyses, collaborate and share code with others, and communicate your results with others. R Markdown documents can be rendered to many output formats including HTML documents, PDFs, Word files, slideshows, and more.
Go to Resource