Get access to all lessons in this course.
-
Week 1: Getting Started with R
- Welcome to Getting Started with R
- Install R
- Install RStudio
- Projects
- Files in R
- Packages
- Import Data
- Objects and Functions
- Examine our Data
- Import Our Data Again
- Getting Help
- Wrapping Up
- R in 3 Months Spring 2022 Week 1 Live Session
-
Week 2: Fundamentals of R (RMarkdown)
- Welcome to Fundamentals of R
- RMarkdown Overview
- YAML
- Text
- Code Chunks
- Wrapping Up
- R in 3 Months Spring 2022 Week 2 Project Assignment
- R in 3 Months Spring 2022 Week 2 Office Hours
- R in 3 Months Spring 2022 Week 2 Live Session
-
Week 3: Fundamentals of R (Data Wrangling and Analysis)
- Getting Started
- The Tidyverse
- select
- mutate
- filter
- summarize
- group_by
- count
- arrange
- Create a New Data Frame
- Crosstabs
- Wrapping Up
- R in 3 Months Spring 2022 Week 3 Office Hours
- R in 3 Months Spring 2022 Week 3 Live Session
- R in 3 Months Spring 2022 Week 3 Project Assignment
-
Week 4: Fundamentals of R (Data Visualization)
- An Important Workflow Tip
- The Grammar of Graphics
- Scatterplots
- Histograms
- Bar Charts
- color and fill
- scales
- Text and Labels
- Plot Labels
- Themes
- Facets
- Save Plots
- Wrapping Up
- You Did It!
- R in 3 Months Spring 2022 Week 4 Office Hours
- R in 3 Months Spring 2022 Week 4 Live Session
- R in 3 Months Spring 2022 Week 4 Project Assignment
-
Week 5: Catch-Up Week
- R in 3 Months Spring 2022 Week 5 Office Hours
- R in 3 Months Spring 2022 Week 5 Project Assignment: ASSIGNMENT AMNESTY
-
Week 6: Git + GitHub
- What is Git? What is GitHub?
- Why Should You Learn to Use Git and GitHub?
- Update Everything
- Install Git
- Configure Git
- Create a Local Git Repository
- Commits
- Commit History
- GitHub Repositories
- Connect RStudio and GitHub
- Push an RStudio Project to a GitHub Repository
- Pull a GitHub Repository to an RStudio Project
- Keep RStudio and GitHub in Sync
- R in 3 Months Spring 2022 Week 6 Office Hours
- R in 3 Months Spring 2022 Week 6 Live Session
- R in 3 Months Spring 2022 Week 6 Project Assignment
-
Week 7: Going Deeper with R (Advanced Data Wrangling, Part 1)
- Overview
- Importing Data
- Tidy Data
- Reshaping Data
- Dealing with Missing Data
- Changing Variable Types
- Advanced Variable Creation
- Advanced Summarizing
- Binding Data Frames
- R in 3 Months Spring 2022 Week 7 Office Hours
- R in 3 Months Spring 2022 Week 7 Project Assignment
- R in 3 Months Spring 2022 Week 7 Live Session
-
Week 8: Going Deeper with R (Advanced Data Wrangling, Part 2)
- Functions
- Merging Data
- Renaming Variables
- Quick Interlude to Reorganize our Code
- Exporting Data
- R in 3 Months Spring 2022 Week 8 Office Hours
- R in 3 Months Spring 2022 Week 8 Live Session
- R in 3 Months Spring 2022 Week 8 Project Assignment
-
Week 9: Catch-Up Week
- R in 3 Months Spring 2022 Week 9 Office Hours
- R in 3 Months Spring 2022 Week 9 - Assignment Amnesty
-
Week 10: Going Deeper with R (Advanced Data Visualization, Part 1)
- Data Visualization Best Practices
- Tidy Data
- Pipe Data Into ggplot
- Reorder Plots to Highlight Findings
- Line Charts
- Use Color to Highlight Findings
- Declutter
- Use the scales Package for Nicely Formatted Values
- Use Direct Labeling
- R in 3 Months Spring 2022 Week 10 Office Hours
- R in 3 Months Spring 2022 Week 10 Live Session
- R in 3 Months Spring 2022 Week 10 Project Assignment
-
Week 11: Going Deeper with R (Advanced Data Visualization, Part 2)
- Use Axis Text Wisely
- Use Titles to Highlight Findings
- Use Color in Titles to Highlight Findings
- Use Annotations to Explain
- Tweak Spacing
- Customize Your Theme
- Customize Your Fonts
- Try New Plot Types
- R in 3 Months Spring 2022 Week 11 Live Session
- R in 3 Months Spring 2022 Week 11 Office Hours
- R in 3 Months Spring 2022 Week 11 Project Assignment
-
Week 12: Going Deeper with R (Advanced RMarkdown)
- Advanced Markdown Text Formatting
- Tables
- Advanced YAML
- Inline R Code
- Making Your Reports Shine: Word Edition
- Making Your Reports Shine: HTML Edition
- Making Your Reports Shine: PDF Edition
- Presentations
- Dashboards
- Other Formats
- You Did It!
- R in 3 Months Spring 2022 Week 12 Office Hours
- R in 3 Months Spring 2022 Week 12 Live Session
- R in 3 Months Spring 2022 Week 12 Project Assignment
-
Week 13: Final Assignment
- R in 3 Months Spring 2022 Week 13 Office Hours
- R in 3 Months Spring 2022 Week 13 Live Session
- R in 3 Months Spring 2022 Final Project Assignment
-
WEEK 14: Retrospective
R in 3 Months (Spring 2022)
R in 3 Months Spring 2022 Week 11 Project Assignment
This lesson is locked
This lesson is called R in 3 Months Spring 2022 Week 11 Project Assignment, part of the R in 3 Months (Spring 2022) course. This lesson is called R in 3 Months Spring 2022 Week 11 Project Assignment, part of the R in 3 Months (Spring 2022) course.
In this week's assignment we're asking you to think about alternative ways to visualise your data and how to make your charts tell stories.
To help you come up with ideas I've put together this collection of charts in the image below. All of the code can be found in this repository.
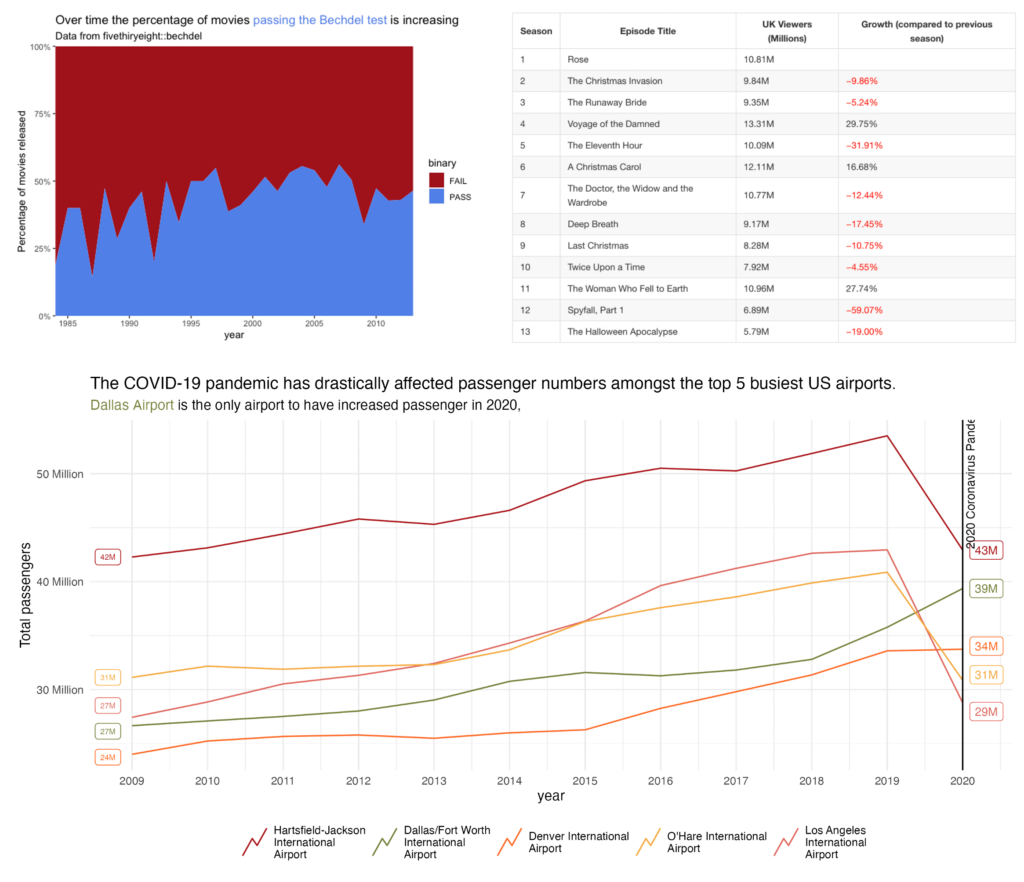
We're not looking for perfection or to use all of the things introduced in this week. We really hope that R in 3 Months inspires you to try new things and understand how to turn your ideas into working code.
If you have any questions about these techniques then please do open a discussion thread and we'll get to you ASAP.
You need to be signed-in to comment on this post. Login.