Get access to all lessons in this course.
-
Week 1: Getting Started with R
- Welcome to Getting Started with R
- Install R
- Install RStudio
- Projects
- Files in R
- Packages
- Import Data
- Objects and Functions
- Examine our Data
- Import Our Data Again
- Getting Help
- Wrapping Up
- R in 3 Months Spring 2022 Week 1 Live Session
-
Week 2: Fundamentals of R (RMarkdown)
- Welcome to Fundamentals of R
- RMarkdown Overview
- YAML
- Text
- Code Chunks
- Wrapping Up
- R in 3 Months Spring 2022 Week 2 Project Assignment
- R in 3 Months Spring 2022 Week 2 Office Hours
- R in 3 Months Spring 2022 Week 2 Live Session
-
Week 3: Fundamentals of R (Data Wrangling and Analysis)
- Getting Started
- The Tidyverse
- select
- mutate
- filter
- summarize
- group_by
- count
- arrange
- Create a New Data Frame
- Crosstabs
- Wrapping Up
- R in 3 Months Spring 2022 Week 3 Office Hours
- R in 3 Months Spring 2022 Week 3 Live Session
- R in 3 Months Spring 2022 Week 3 Project Assignment
-
Week 4: Fundamentals of R (Data Visualization)
- An Important Workflow Tip
- The Grammar of Graphics
- Scatterplots
- Histograms
- Bar Charts
- color and fill
- scales
- Text and Labels
- Plot Labels
- Themes
- Facets
- Save Plots
- Wrapping Up
- You Did It!
- R in 3 Months Spring 2022 Week 4 Office Hours
- R in 3 Months Spring 2022 Week 4 Live Session
- R in 3 Months Spring 2022 Week 4 Project Assignment
-
Week 5: Catch-Up Week
- R in 3 Months Spring 2022 Week 5 Office Hours
- R in 3 Months Spring 2022 Week 5 Project Assignment: ASSIGNMENT AMNESTY
-
Week 6: Git + GitHub
- What is Git? What is GitHub?
- Why Should You Learn to Use Git and GitHub?
- Update Everything
- Install Git
- Configure Git
- Create a Local Git Repository
- Commits
- Commit History
- GitHub Repositories
- Connect RStudio and GitHub
- Push an RStudio Project to a GitHub Repository
- Pull a GitHub Repository to an RStudio Project
- Keep RStudio and GitHub in Sync
- R in 3 Months Spring 2022 Week 6 Office Hours
- R in 3 Months Spring 2022 Week 6 Live Session
- R in 3 Months Spring 2022 Week 6 Project Assignment
-
Week 7: Going Deeper with R (Advanced Data Wrangling, Part 1)
- Overview
- Importing Data
- Tidy Data
- Reshaping Data
- Dealing with Missing Data
- Changing Variable Types
- Advanced Variable Creation
- Advanced Summarizing
- Binding Data Frames
- R in 3 Months Spring 2022 Week 7 Office Hours
- R in 3 Months Spring 2022 Week 7 Project Assignment
- R in 3 Months Spring 2022 Week 7 Live Session
-
Week 8: Going Deeper with R (Advanced Data Wrangling, Part 2)
- Functions
- Merging Data
- Renaming Variables
- Quick Interlude to Reorganize our Code
- Exporting Data
- R in 3 Months Spring 2022 Week 8 Office Hours
- R in 3 Months Spring 2022 Week 8 Live Session
- R in 3 Months Spring 2022 Week 8 Project Assignment
-
Week 9: Catch-Up Week
- R in 3 Months Spring 2022 Week 9 Office Hours
- R in 3 Months Spring 2022 Week 9 - Assignment Amnesty
-
Week 10: Going Deeper with R (Advanced Data Visualization, Part 1)
- Data Visualization Best Practices
- Tidy Data
- Pipe Data Into ggplot
- Reorder Plots to Highlight Findings
- Line Charts
- Use Color to Highlight Findings
- Declutter
- Use the scales Package for Nicely Formatted Values
- Use Direct Labeling
- R in 3 Months Spring 2022 Week 10 Office Hours
- R in 3 Months Spring 2022 Week 10 Live Session
- R in 3 Months Spring 2022 Week 10 Project Assignment
-
Week 11: Going Deeper with R (Advanced Data Visualization, Part 2)
- Use Axis Text Wisely
- Use Titles to Highlight Findings
- Use Color in Titles to Highlight Findings
- Use Annotations to Explain
- Tweak Spacing
- Customize Your Theme
- Customize Your Fonts
- Try New Plot Types
- R in 3 Months Spring 2022 Week 11 Live Session
- R in 3 Months Spring 2022 Week 11 Office Hours
- R in 3 Months Spring 2022 Week 11 Project Assignment
-
Week 12: Going Deeper with R (Advanced RMarkdown)
- Advanced Markdown Text Formatting
- Tables
- Advanced YAML
- Inline R Code
- Making Your Reports Shine: Word Edition
- Making Your Reports Shine: HTML Edition
- Making Your Reports Shine: PDF Edition
- Presentations
- Dashboards
- Other Formats
- You Did It!
- R in 3 Months Spring 2022 Week 12 Office Hours
- R in 3 Months Spring 2022 Week 12 Live Session
- R in 3 Months Spring 2022 Week 12 Project Assignment
-
Week 13: Final Assignment
- R in 3 Months Spring 2022 Week 13 Office Hours
- R in 3 Months Spring 2022 Week 13 Live Session
- R in 3 Months Spring 2022 Final Project Assignment
-
WEEK 14: Retrospective
R in 3 Months (Spring 2022)
Tidy Data
This lesson is locked
This lesson is called Tidy Data, part of the R in 3 Months (Spring 2022) course. This lesson is called Tidy Data, part of the R in 3 Months (Spring 2022) course.
If the video is not playing correctly, you can watch it in a new window
Transcript
Click on the transcript to go to that point in the video. Please note that transcripts are auto generated and may contain minor inaccuracies.
Your Turn
Read the Tidy Data vignette
Take a look at your data and see which principles of tidy data it violates
Learn More
In the video, I only talk about two types of data tidying: each variable forming a column and each type of observational unit forming a table. If you want to see examples of the third type (each observation forming a row), check out the tidy data vignette from the tidyr package.
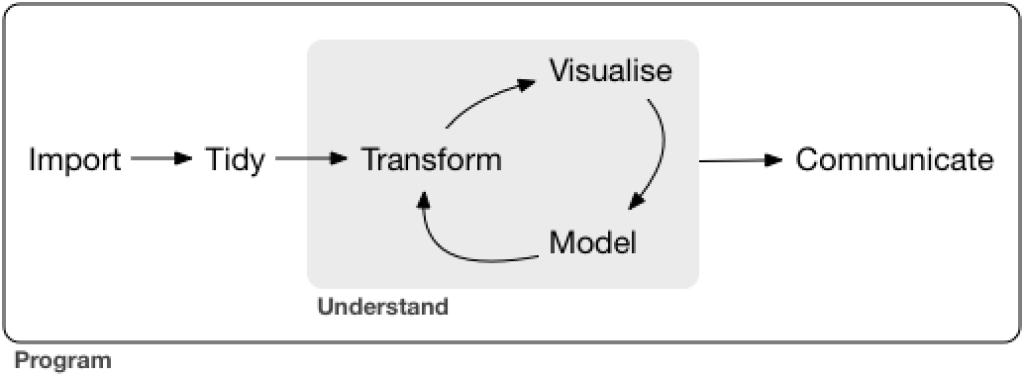
The workflow diagram I talked about is from Chapter 1 of R for Data Science.
One small note unrelated to the main content of this lesson: I recorded it before dplyr 1.0 was released. If you have this version of dplyr installed, you have access to the across() function, which enables you to do summaries across rows. My example of finding it challenging to summarize German speakers data across rows would be much easier using the across() function. However, I still think that in most cases, it is easier to tidy your data and work with it in that format.
You need to be signed-in to comment on this post. Login.
Vuk Sekicki
April 19, 2021
Hello David,
Could you help me out understanding this: names_pattern = "(.)(.+)"
Specifically what is "(.)(.+)"
Thanks.
Matt M
November 9, 2021
I see you re-worded the 3 rules of tidy data from the vignette. Although I think I understand conceptually what is being sought, I'm not sure I follow what each rule means (i.e., what I need to do to make sure that I'm complying with the rule) and what a violation of each rule looks like (the third rule in particular)