Get access to all lessons in this course.
-
Week 1: Getting Started with R
- Welcome to Getting Started with R
- Install R
- Install RStudio
- Projects
- Files in R
- Packages
- Import Data
- Objects and Functions
- Examine our Data
- Import Our Data Again
- Getting Help
- Wrapping Up
- R in 3 Months Spring 2022 Week 1 Live Session
-
Week 2: Fundamentals of R (RMarkdown)
- Welcome to Fundamentals of R
- RMarkdown Overview
- YAML
- Text
- Code Chunks
- Wrapping Up
- R in 3 Months Spring 2022 Week 2 Project Assignment
- R in 3 Months Spring 2022 Week 2 Office Hours
- R in 3 Months Spring 2022 Week 2 Live Session
-
Week 3: Fundamentals of R (Data Wrangling and Analysis)
- Getting Started
- The Tidyverse
- select
- mutate
- filter
- summarize
- group_by
- count
- arrange
- Create a New Data Frame
- Crosstabs
- Wrapping Up
- R in 3 Months Spring 2022 Week 3 Office Hours
- R in 3 Months Spring 2022 Week 3 Live Session
- R in 3 Months Spring 2022 Week 3 Project Assignment
-
Week 4: Fundamentals of R (Data Visualization)
- An Important Workflow Tip
- The Grammar of Graphics
- Scatterplots
- Histograms
- Bar Charts
- color and fill
- scales
- Text and Labels
- Plot Labels
- Themes
- Facets
- Save Plots
- Wrapping Up
- You Did It!
- R in 3 Months Spring 2022 Week 4 Office Hours
- R in 3 Months Spring 2022 Week 4 Live Session
- R in 3 Months Spring 2022 Week 4 Project Assignment
-
Week 5: Catch-Up Week
- R in 3 Months Spring 2022 Week 5 Office Hours
- R in 3 Months Spring 2022 Week 5 Project Assignment: ASSIGNMENT AMNESTY
-
Week 6: Git + GitHub
- What is Git? What is GitHub?
- Why Should You Learn to Use Git and GitHub?
- Update Everything
- Install Git
- Configure Git
- Create a Local Git Repository
- Commits
- Commit History
- GitHub Repositories
- Connect RStudio and GitHub
- Push an RStudio Project to a GitHub Repository
- Pull a GitHub Repository to an RStudio Project
- Keep RStudio and GitHub in Sync
- R in 3 Months Spring 2022 Week 6 Office Hours
- R in 3 Months Spring 2022 Week 6 Live Session
- R in 3 Months Spring 2022 Week 6 Project Assignment
-
Week 7: Going Deeper with R (Advanced Data Wrangling, Part 1)
- Overview
- Importing Data
- Tidy Data
- Reshaping Data
- Dealing with Missing Data
- Changing Variable Types
- Advanced Variable Creation
- Advanced Summarizing
- Binding Data Frames
- R in 3 Months Spring 2022 Week 7 Office Hours
- R in 3 Months Spring 2022 Week 7 Project Assignment
- R in 3 Months Spring 2022 Week 7 Live Session
-
Week 8: Going Deeper with R (Advanced Data Wrangling, Part 2)
- Functions
- Merging Data
- Renaming Variables
- Quick Interlude to Reorganize our Code
- Exporting Data
- R in 3 Months Spring 2022 Week 8 Office Hours
- R in 3 Months Spring 2022 Week 8 Live Session
- R in 3 Months Spring 2022 Week 8 Project Assignment
-
Week 9: Catch-Up Week
- R in 3 Months Spring 2022 Week 9 Office Hours
- R in 3 Months Spring 2022 Week 9 - Assignment Amnesty
-
Week 10: Going Deeper with R (Advanced Data Visualization, Part 1)
- Data Visualization Best Practices
- Tidy Data
- Pipe Data Into ggplot
- Reorder Plots to Highlight Findings
- Line Charts
- Use Color to Highlight Findings
- Declutter
- Use the scales Package for Nicely Formatted Values
- Use Direct Labeling
- R in 3 Months Spring 2022 Week 10 Office Hours
- R in 3 Months Spring 2022 Week 10 Live Session
- R in 3 Months Spring 2022 Week 10 Project Assignment
-
Week 11: Going Deeper with R (Advanced Data Visualization, Part 2)
- Use Axis Text Wisely
- Use Titles to Highlight Findings
- Use Color in Titles to Highlight Findings
- Use Annotations to Explain
- Tweak Spacing
- Customize Your Theme
- Customize Your Fonts
- Try New Plot Types
- R in 3 Months Spring 2022 Week 11 Live Session
- R in 3 Months Spring 2022 Week 11 Office Hours
- R in 3 Months Spring 2022 Week 11 Project Assignment
-
Week 12: Going Deeper with R (Advanced RMarkdown)
- Advanced Markdown Text Formatting
- Tables
- Advanced YAML
- Inline R Code
- Making Your Reports Shine: Word Edition
- Making Your Reports Shine: HTML Edition
- Making Your Reports Shine: PDF Edition
- Presentations
- Dashboards
- Other Formats
- You Did It!
- R in 3 Months Spring 2022 Week 12 Office Hours
- R in 3 Months Spring 2022 Week 12 Live Session
- R in 3 Months Spring 2022 Week 12 Project Assignment
-
Week 13: Final Assignment
- R in 3 Months Spring 2022 Week 13 Office Hours
- R in 3 Months Spring 2022 Week 13 Live Session
- R in 3 Months Spring 2022 Final Project Assignment
-
WEEK 14: Retrospective
R in 3 Months (Spring 2022)
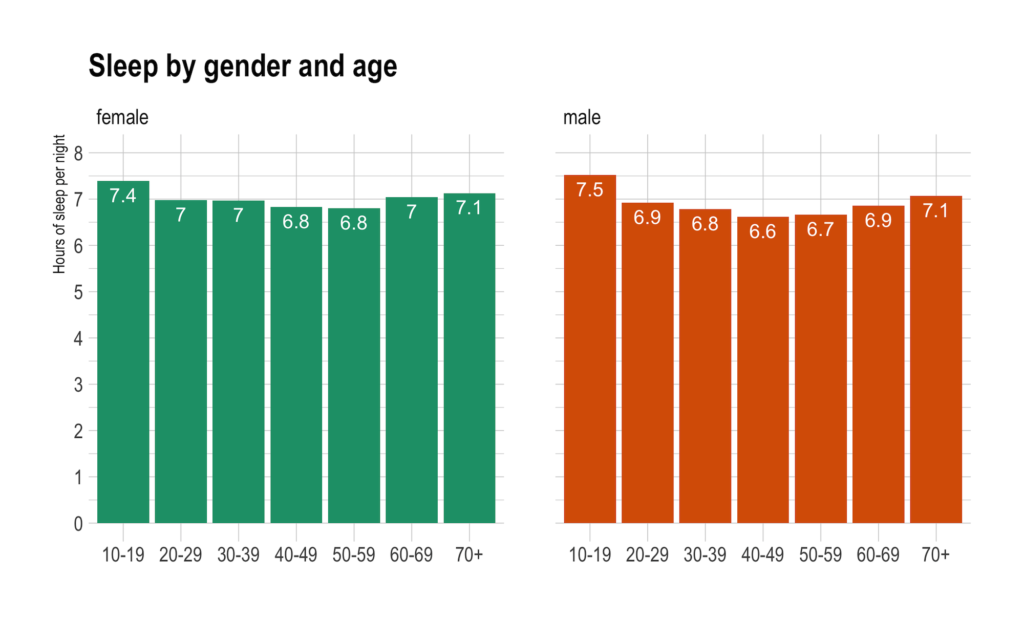
Facets
This lesson is locked
This lesson is called Facets, part of the R in 3 Months (Spring 2022) course. This lesson is called Facets, part of the R in 3 Months (Spring 2022) course.
If the video is not playing correctly, you can watch it in a new window
Transcript
Click on the transcript to go to that point in the video. Please note that transcripts are auto generated and may contain minor inaccuracies.
Heads up!
Definitely take a look at the solutions video for this lesson (once you've tried it yourself!). It goes through the exercise for this lesson, which is quite challenging, step by step and provides an overview of how you can think about creating a plot you see elsewhere with code that you write.
Your Turn
Complete the facets sections of the data-visualization-exercises.Rmd file. You'll be asked to recreate a visualization as part of this. Here is the image for your reference:
Learn More
Facets Resources
Chapter 11 of the R Graphics Cookbook covers facets. Kieran Healy discusses them in Chapter 4 of Data Visualization: A Practical Introduction, as does Claus Wilke in Chapter 21 of Fundamentals of Data Visualization.
I’ve also written an article about the value of small multiples. It includes some code for making them.
Note that, while I’ve only showed you facet_wrap, there is also a facet_grid function that you might want to explore as well. Both are discussed in the R Graph Gallery article on facets.
You need to be signed-in to comment on this post. Login.
Erin Guthrie
April 4, 2021
When I run the code (with some help from the solutions video), I get a message font family not found in Windows font database. The graphs and the labels are on top of each other. Is this something having to do with the theme?
Abby Isaacson
April 15, 2021
Do you know why my bar outlines might be blue, even when running your solution code? The fills are all correct. After I installed devtools I think this started happening in both my Rmarkdown files.
JULIO VERA DE LEON
March 31, 2022
Hi! How do you change "female" and "male" to "Female" and "Male"? Thanks!
Mychal Davis
April 7, 2022
Hello,
I am not able to install any themes, when I try I get this error message "Error in loadNamespace(j <- i[[1L]], c(lib.loc, .libPaths()), versionCheck = vI[[j]]) : there is no package called ‘cli’".
Originally the error message stated, "Error in loadNamespace(j = 3.1.0 is required." So I attempted to update the package, but an error occurred when I tired to update it. I uninstalled the package and tired to reinstall it, but when I attempted to reinstall the package I received an error message.
Amanda Krantz
October 26, 2022
I am able to generate the same graph, except the font size of the ages labels on the x axis are bigger and do they are squished together. I am getting errors about the Windows fonts, but it is still generating the graph otherwise, so maybe I just need to fix those fonts per the last lesson?
Melissa Mullins
April 19, 2023
The facetting seems like it will be incredibly useful. I did have the same trouble as some people in the past with the overlapping font on the x-axis (whether I ran the code I wrote or the one from the solutions). I see there is a new video about this coming up so I look forward to learning more.