Resources
This carefully curated collection of resources will help you find packages and learning resources to help you on your R journey.
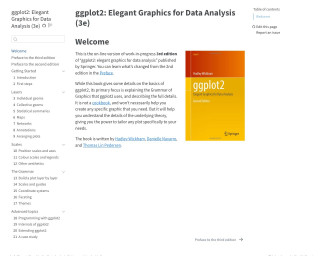
ggplot2: elegant graphics for data analysis
This is the online version of the work-in-progress 3rd edition of 'ggplot2: Elegant Graphics for Data Analysis'. The book focuses on explaining the Grammar of Graphics used in ggplot2 and provides details on the underlying theory. It is written by Hadley Wickham, Danielle Navarro, and Thomas Lin Pedersen.
Go to Resource
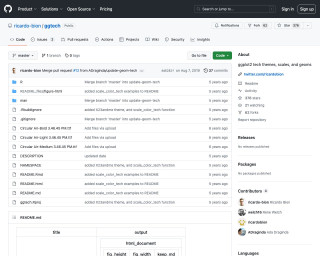
ggtech
ggtech is a package that provides ggplot2 tech themes, scales, and geoms for creating visually appealing plots in R.
Go to Resource
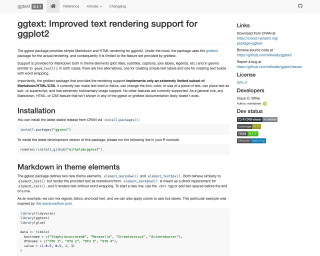
ggtext
The ggtext package provides simple Markdown and HTML rendering support for ggplot2 in R.
Go to Resource
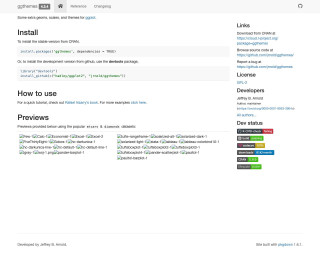
ggthemr
Themes for ggplot2. The idea of this package is that you can just set the theme and then forget about it. You shouldn't have to change any of your existing code.
Go to Resource
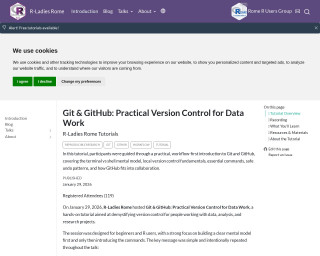
Git & GitHub: Practical Version Control for Data Work
R-Ladies Rome hosted a tutorial titled 'Git & GitHub: Practical Version Control for Data Work' on January 29, 2026. The session provided a beginner-friendly, workflow-oriented introduction to Git and GitHub for those working with data and research. It started with the basics of terminal and shell concepts, then covered local version control with Git, essential commands, and undo strategies, before integrating GitHub for sharing and collaboration. Federica Gazzelloni led the tutorial, emphasizing a clear understanding first before diving into practice. Resources included a workshop guide, slides, and a recording for self-paced learning. The aim was to demystify version control and foster reproducible workflows for data work.
Go to Resource
Git for Humans
A talk by Alice Bartlett at UX Brighton 2016 about using Git for humans.
Go to Resource
GitHub - cj-holmes/toast: Ordering images of toast from least toasted to most toasted...
Ordering images of toast from least toasted to most toasted using R language
Go to Resource
GitHub - hughjonesd/ggmagnify: Create a magnified inset of part of a ggplot object
Create a magnified inset of part of a ggplot object
Go to Resource