Resources
This carefully curated collection of resources will help you find packages and learning resources to help you on your R journey.
GitHub - marcuslowx/HighContrast: An R package for making high contrast themes with ggplot2 for people with substantially impaired vision.
An R package for making high contrast themes with ggplot2 for people with substantially impaired vision.
Go to Resource
GitHub - nicucalcea/Ra11y: Collection of accessibility functions for R
Collection of accessibility functions for R
Go to Resource
GitHub - sebdalgarno/tinter: An R package to get tints and shades (and both) of a colour
An R package to get tints and shades (and both) of a colour
Go to Resource
GitHub - teunbrand/ggplot_tricks: Here, I collect some tricks I've learned about the {ggplot2} R package
A collection of tricks and tips for using the ggplot2 R package.
Go to Resource
GitHub - teunbrand/ggplot_tricks: Here, I collect some tricks I've learned about the {ggplot2} R package
A collection of tricks and tips for using the ggplot2 R package.
Go to Resource

golem
golem is an opinionated framework for building production-grade shiny applications.
Go to Resource
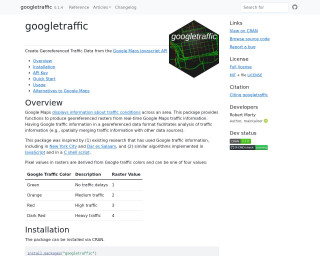
googletraffic
The 'googletraffic' package facilitates creating georeferenced traffic data using Google Maps Javascript API. It allows for the creation of rasters representing traffic conditions with pixel values indicating varying levels of traffic. The package can produce traffic data around specific points or polygons and requires a Google API key. It's useful for merging traffic data with other spatial datasets. The package includes functions for installation, configuration, and visualization of traffic rasters. Alternatives like Mapbox are mentioned, with differences in data format and coverage outlined.
Go to Resource

Greenland ice thickness
This resource provides a tutorial on using R to visualize the thickness of Greenland's ice, based on data from Bamber (2001). The data is formatted as a fixed width ASCII file and requires wrangling to be processed with R packages such as terra, readr, dplyr, and tidyr. After cleaning and projecting the data into a suitable format, the resource guides creating both raw and interactive polar stereographic maps. The tutorial includes R code snippets, methods for arranging and visualizing the data with ggplot2 and leaflet, and a discussion on the relevance of ice thickness in Arctic studies.
Go to Resource
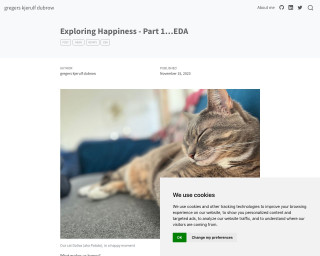
gregers kjerulf dubrow - Exploring Happiness - Part 1…EDA
This text is about exploring happiness and conducting exploratory data analysis using R language. It discusses the World Happiness Report data and the process of importing and cleaning the data in RStudio. The author also mentions using packages like DataExplorer and explorer for EDA. The text provides code snippets for data loading and mentions the use of tidyverse, tidylog, and janitor packages.
Go to Resource
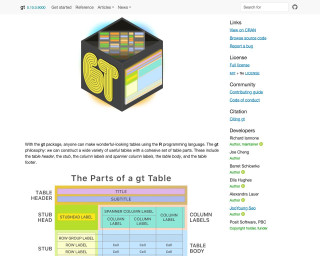
gt
With the gt package, anyone can make wonderful-looking tables using the R programming language.
Go to Resource