Resources
This carefully curated collection of resources will help you find packages and learning resources to help you on your R journey.
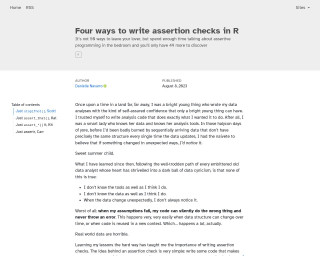
Four ways to write assertion checks in R
This content provides a personal narrative detailing the importance of writing assertion checks in R, particularly when dealing with data that can change structure over time. The author shares a transformation from a confident young analyst to one who has learned to be cautious and employ defensive programming techniques. The focus is on the 'identifier' function, illustrating the need for assertions with 'stopifnot()' to handle unexpected and incorrect inputs. The article emphasizes rigorous validation of assumptions to prevent silent errors in code.
Go to Resource
From RStudio to Positron: A Better Data Science IDE (R and Python)
Susan Buck offers a guided tour of Positron, Posit’s newer data science IDE built for both R and Python. The video walks through the Positron interface—including the activity bar, editor, console, and sidebars—and draws direct comparisons to familiar RStudio workflows to help users orient themselves quickly.
Go to Resource
Full-Stack Survey Research with SurveyMonkey • svmkR
This package provides a suite of tools to work with SurveyMonkey surveys in R.
Go to Resource
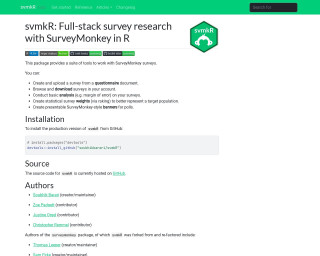
Full-Stack Survey Research with SurveyMonkey • svmkR
svmkR is an R package that provides a comprehensive toolkit for managing SurveyMonkey surveys within the R programming environment. It enables users to create, upload, download, and analyze surveys directly from R. Users can calculate margins of error, apply statistical survey weights through raking, and generate SurveyMonkey-style banner presentations for polls. The package is installed from GitHub and serves as a full-stack survey research solution. The source is available on GitHub, and the package was developed by a team of contributors, building on the surveymonkey package by enhancing and refactoring it.
Go to Resource
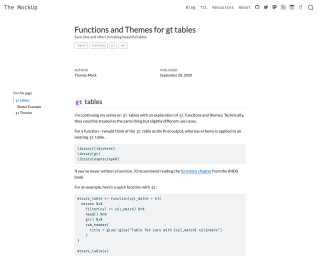
Functions and Themes for gt tables
A tutorial on using functions and themes for creating gt tables in R language.
Go to Resource
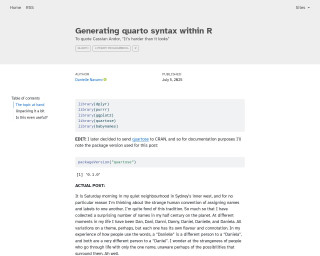
Generating quarto syntax within R – Notes from a data witch
This blog post introduces 'quartose', an R package designed to integrate with Quarto for literate programming. The author, located in Sydney, discusses the nuances of names and their personal connection to this topic before exploring a data analysis task using the 'babynames' package. The analysis involves mapping names to data frames and visualizing name popularity over time. The post concludes with a demonstration of 'quarto_tabset()' that allows inserting plots or data frames into a document as a tabbed interface, enhancing the presentation of data in a readable and interactive format.
Go to Resource
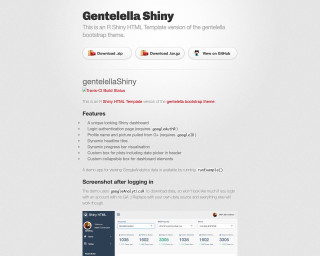
Gentelella Shiny
This is an R Shiny HTML Template version of the gentelella bootstrap theme. It provides a unique looking Shiny dashboard with features like login authentication, dynamic progress bar visualization, custom boxes for plots, and more.
Go to Resource
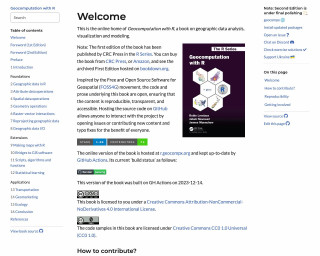
Geocomputation with R
Geocomputation with R is a book on geographic data analysis, visualization, and modeling. It covers various topics related to working with geographic data in R.
Go to Resource
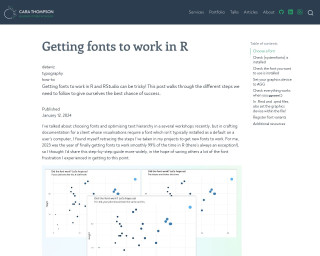
Getting fonts to work in R
Getting fonts to work in R and RStudio can be tricky! This post walks through the different steps we need to follow to give ourselves the best chance of success.
Go to Resource
Getting more out of dplyr
Video presentation by Suzan Baert on getting more out of dplyr at SatRday 2018 Amsterdam.
Go to Resource