Resources
This carefully curated collection of resources will help you find packages and learning resources to help you on your R journey.
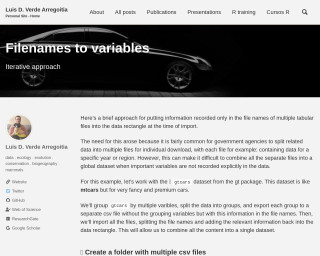
Filenames to variables
This content describes a technique for incorporating information from the filenames of multiple CSV files into a data frame during import. The article is by Luis D. Verde Arregoitia and focuses on the scenario where related data is split across multiple files by government agencies, often with key variables only indicated in each file's name. The tutorial demonstrates using the R programming language to group a dataset by several variables, export each group to its own CSV file without the grouping variables but with the naming reflecting those variables, and then re-importing the files while adding the filename-derived information back into the data frame.
Go to Resource
Fix labels and understand scale functions in ggplot - YouTube
This YouTube video provides an explanation of how to fix labels and understand scale functions in ggplot.
Go to Resource
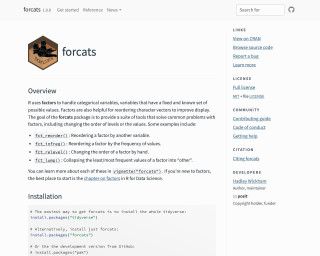
flair
flair is an R package that provides tools for formatting R code in knitted R Markdown files.
Go to Resource
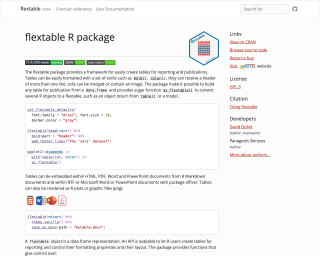
flextable
The flextable package provides a framework for easily creating tables for reporting and publications in R. It allows for easy formatting and customization of tables, and supports various output formats including HTML, PDF, Word, PowerPoint, and more. The package also provides functions for tabular reporting of statistical models and the creation of complex cross tabulations.
Go to Resource
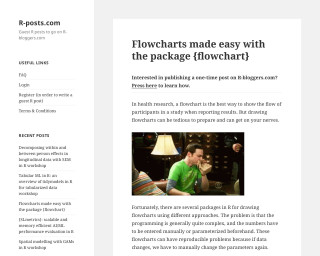
Flowcharts made easy with the package {flowchart}
The {flowchart} package in R facilitates the creation of flowcharts, particularly useful in health research to show participant flow in studies. It integrates with the tidyverse workflow, offering customizable functions that work with pipe operators. Unlike other packages, it adapts flowcharts automatically to the data, enhancing reproducibility. The post explains installation, initialization, and drawing processes using the SAFO clinical trial dataset. It's easy to produce complex flowcharts without manual parameter setting thanks to the package's tidyverse-centric design.
Go to Resource
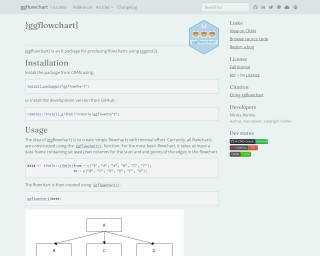
Flowcharts with ggplot2 • ggflowchart
The {ggflowchart} package for R is a specialized tool designed to create flowcharts using the {ggplot2} framework with simplicity and minimal effort. You can install either the stable CRAN release or the development version from GitHub. Users can generate basic flowcharts by defining start and end points of edges within a data frame, and then invoking the ggflowchart() function. Additional customization is possible through aesthetic mappings such as fill, text color, and future updates may introduce further options. The package also encourages contributions, setting guidelines for pull requests including passing checks and following best practices in development.
Go to Resource
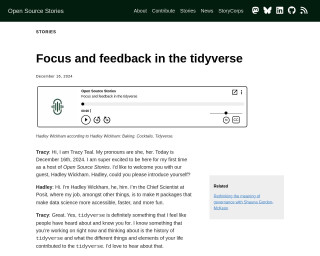
Focus and feedback in the tidyverse
This content features Tracy Teal interviewing Hadley Wickham for Open Source Stories, discussing the tidyverse's history and its influences. Hadley reflects on his parents' influence and his role as Posit's Chief Scientist in making data science more accessible. Themes include early computing exposure, relational databases, tidy data principles, and the balance between assisting and imposing solutions. Personal anecdotes highlight how Hadley's upbringing shaped the development of tidyverse tools aimed at simplifying and tidying data in R.
Go to Resource

For fs – Notes from a data witch
The blog post discusses the 'fs' R package, which provides a cross-platform interface for filesystem operations, replacing base R functions like file.path(). Despite the belief that such a package is boring, the author emphasizes the hidden nuances and pitfalls in seemingly simple tasks like specifying file paths. The post illustrates the benefits of using fs's path() function over paste() to avoid errors in large projects where file paths could become complex to handle. The inclusion of a conversation with the author's alter ego adds humor, portraying the challenge in writing about a technical and unglamorous tool.
Go to Resource
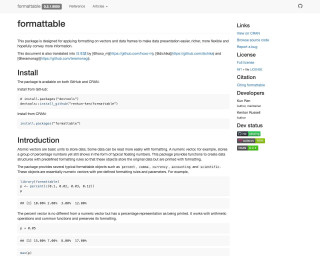
formattable
This package is designed for applying formatting on vectors and data frames to make data presentation easier, richer, more flexible and hopefully convey more information.
Go to Resource

Formatted Spreadsheets to gts • forgts
The forgts package provides a way to convert spreadsheets into gt tables while preserving cell and text formatting from the original file. It supports a variety of format attributes, including font styles, cell fills, and borders, but intentionally ignores header formatting. This tool iterates over the gt defaults to apply necessary styling. Useful in data reporting and visualization, forgts allows easy installation from GitHub and seamless integration with RMarkdown and Quarto, completed by exporting functionalities with gt::gtsave(). It facilitates creating visually consistent tables for analysis and presentation within the R ecosystem.
Go to Resource