Get access to all lessons in this course.
- Welcome to Mapping with R (01_01)
-
Geospatial Data
- Making Maps is Complex (01_02)
- mapview for Quick Maps (01_03)
- sf for Simple Features (01_04)
- Turning Data Frames into sf Objects (01_05)
- Importing Shapefiles (01_06)
- Joining Geospatial Datasets (01_07)
- Disambiguating Country Names (01_08)
- Converting Addresses to Coordinates (01_09)
- U.S.-Specific Datasets (01_10)
- Advice on Finding International Datasets (01_11)
- CRS and Projections: Geographic and Projected CRS (01_12)
- CRS and Projections: How to Choose a CRS (01_13)
- Introducing Raster GIS with raster and stars (01_14)
- Basics of Using the raster Package (01_15)
-
Static Maps
- ggplot2 Essentials (02_01)
- Starting a Map in ggplot2 (02_02)
- Labelling ggplot2 Maps (02_03)
- Compare Locations/Events with Geobubble Charts (02_04)
- Highlight a Region in a Country with ggplot2 (02_05)
- Make a Choropleth Map of Discrete Variables with ggplot2 (02_06)
- Make a Choropleth Map of Continuous Variables with ggplot2 (02_07)
- Faceting Choropleth Maps with ggplot2 (02_08)
- Visualize Raster Data with ggplot2 (02_09)
- Adding Scale Bars and North Arrows with ggplot2 (02_10)
-
Interactive Maps
- What is leaflet? (03_01)
- Starting a Map in leaflet (03_02)
- Necessary HTML for Labelling leaflet Maps (03_03)
- Highlight a Region in a Country with leaflet (03_04)
- Compare Locations/Events with Geobubble Charts in leaflet (03_05)
- Make a Choropleth Map of Discrete Variables with leaflet (03_06)
- Make a Choropleth Map of Continuous Variables with leaflet (03_07)
- Visualize Raster Data with leaflet (03_08)
-
Wrapping Up
- You Did It!
Mapping with R
Make a Choropleth Map of Continuous Variables with leaflet (03_07)
This lesson is locked
This lesson is called Make a Choropleth Map of Continuous Variables with leaflet (03_07), part of the Mapping with R course. This lesson is called Make a Choropleth Map of Continuous Variables with leaflet (03_07), part of the Mapping with R course.
If the video is not playing correctly, you can watch it in a new window
Transcript
Click on the transcript to go to that point in the video. Please note that transcripts are auto generated and may contain minor inaccuracies.
Your Turn
Open project 03_07. Use the your-turn.R script in 03_07 to build this map.
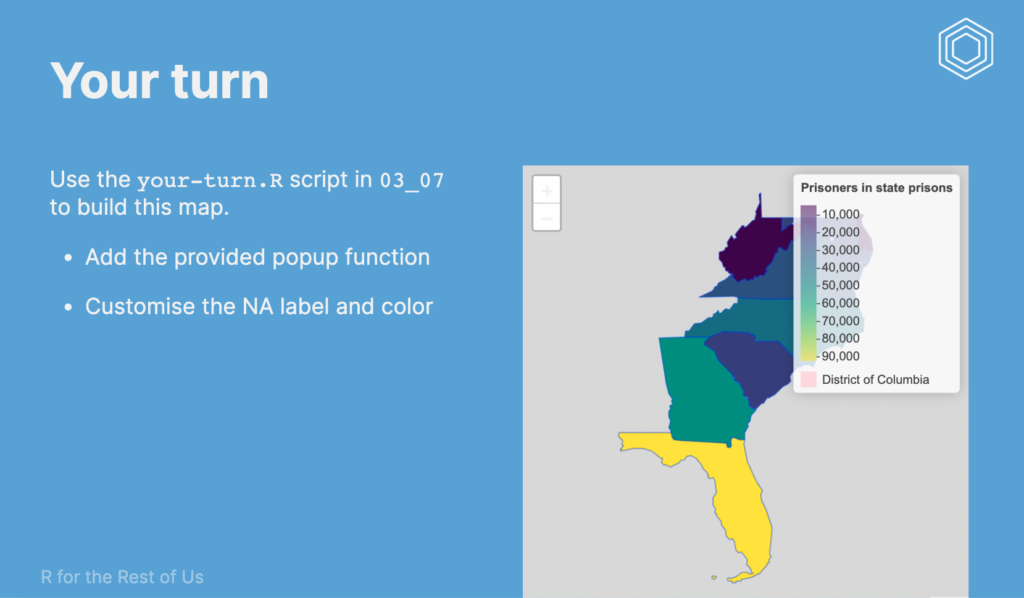
Add the provided popup function
Customise the NA label and color
Learn More
As mentioned in the video there’s a known issue with NA legend items being placed in a really awkward position. The solution I’ve provided is the only custom CSS I’ve provided in this course.
I’ve also provided you with a function for adding popups to both choropleth that depend on the function pmap(). This is because when the popups are generated the function receives both entire column at once, instead of receiving individual pairs of arguments. To learn more about the mapping functions I highly recommend the Iteration chapter of the R for Data Science book.
You need to be signed-in to comment on this post. Login.
Kristina Bratkova
May 27, 2022
Hello, many thanks for the course; great content! I had a question about CRS.
london_school_leavers_sfcreates error when mapped and needs to be transformed to 4326. However,south_atlantic_prisonsdoes not create an error (NAD83 general US CRS is used). Is BNG special CRS that leaflet struggles with? Also, at this large scale, is there a visual difference between using a national CRS compared to 4326?