Get access to all lessons in this course.
-
Advanced Data Wrangling
- Downloading and Importing Data
- Overview of Tidy Data
- Tidy Data Rule #1: Every Column is a Variable
- Tidy Data Rule #3: Every Cell is a Single Value
- Tidy Data Rule #2: Every Row is an Observation
- Changing Variable Types
- Dealing with Missing Data
- Advanced Summarizing
- Binding Data Frames
- Functions
- Data Merging
- Exporting Data
- Bring It All Together (Advanced Data Wrangling)
-
Advanced Data Visualization
- Best Practices in Data Visualization
- Tidy Data
- Pipe Data into ggplot
- Reorder Plots to Highlight Findings
- Line Charts
- Use Color to Highlight Findings
- Declutter
- Add Descriptive Labels to Your Plots
- Use Titles to Highlight Findings
- Use Annotations to Explain
- Tweak Spacing
- Create a Custom Theme
- Customize Your Fonts
- Try New Plot Types
- Bring it All Together (Advanced Data Visualization)
-
Quarto
- Advanced Markdown
- Advanced YAML and Code Chunk Options
- Tables
- Inline R Code
- Making Your Reports Shine: Word Edition
- Making Your Reports Shine: PDF Edition
- Making Your Reports Shine: HTML Edition
- Presentations
- Dashboards
- Websites
- Publishing Your Work
- Quarto Extensions
- Parameterized Reporting, Part 1
- Parameterized Reporting, Part 2
- Parameterized Reporting, Part 3
- Wrapping up Going Deeper with R
Going Deeper with R
Welcome to Going Deeper with R
This lesson is locked
This lesson is called Welcome to Going Deeper with R, part of the Going Deeper with R course. This lesson is called Welcome to Going Deeper with R, part of the Going Deeper with R course.
If the video is not playing correctly, you can watch it in a new window
Transcript
Click on the transcript to go to that point in the video. Please note that transcripts are auto generated and may contain minor inaccuracies.
Thanks for signing up for Going Deeper with R! I'm delighted to have you here, and I want to make your learning experience as straightforward as possible.
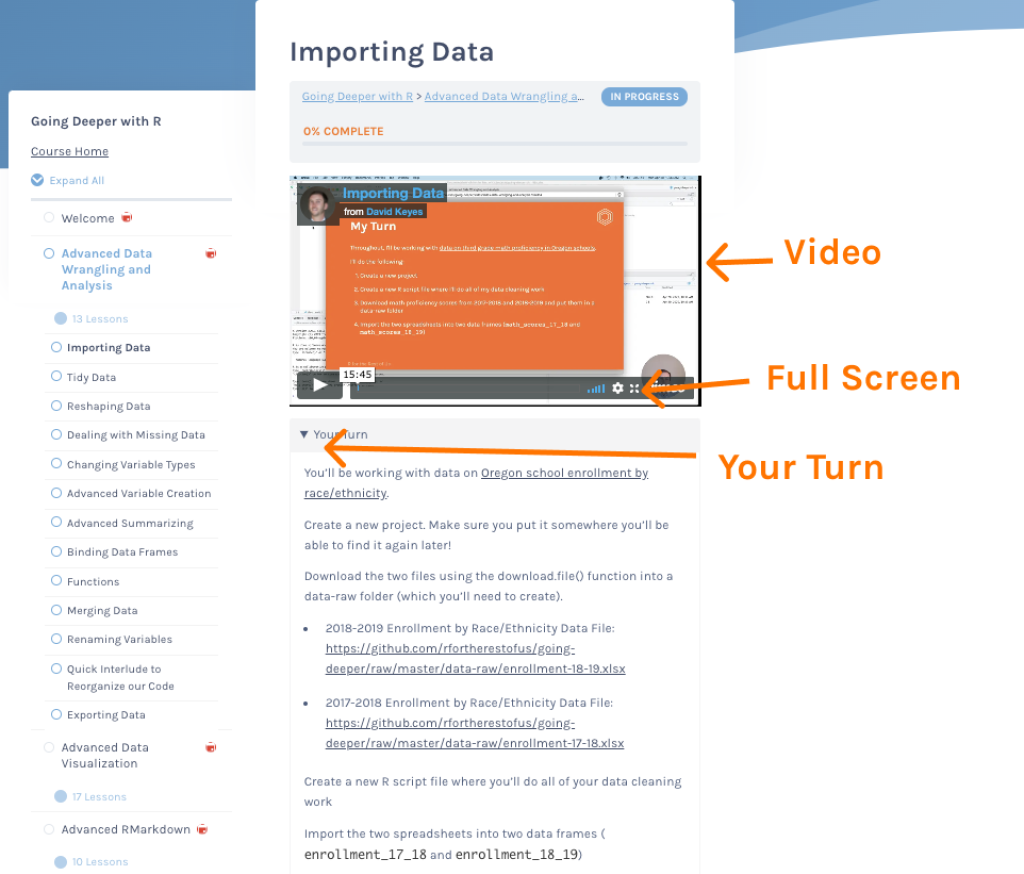
Each lesson in this course has a video where I walk through the main concept being taught. I end each video with a Your Turn section, giving you instructions for completing an exercise on your own. The instructions are also repeated below the video so you have them to refer to. As you can see below, you can click a button to make the videos full screen if that's easier (it often will be in order to see my code).
Below the Your Turn section, you'll find two hidden sections: Solutionsand Learn More. Each Solutions section has both a video walkthrough of me doing the exercise for that lesson as well as the final version of my code. I encourage you to watch these solution videos only after you've attempted the exercise yourself. However, even if you complete an exercise on your own, you may want to watch the solution video, as I'll often point out things there that can be helpful.
The Learn More sections have links to resources to help you go deeper on any topic covered in this course. There are so many talented folks putting out incredible material on R, and I want to help get you plugged into that world.
The overall structure of this course follows that of my other two courses, with one major difference: in Going Deeper with R you do not start with an existing project. Instead, you create your own. I structured the course in this way in order to replicate your actual workflow. Too many learning resources provide artificial coding environments divorced from your actual data practice. I want this course to replicate the actual workflow of a project as much as possible.
My hope is that, when you complete this course, you can take data, no matter how gnarly, and begin to wrangle it into shape for analysis. I want you to be be able to effectively communicate the results of your analysis through clear and compelling visualizations. And I want you to be able to do it all using RMarkdown.
If you have questions as you go through the course, please don't hesitate to reach out.
Slides
You can access all of the slides for this course using the links below.
Data Wrangling and Analysis: HTML / PDF
Data Visualization: HTML / PDF
Search all Videos
Getting Help
If you need help, just enter your question in the section below any lesson and I'll do my best to answer it for you.
You need to be signed-in to comment on this post. Login.
Atlang Mompe
June 28, 2021
Thank you ONCE again David for another easy to follow lesson on very complex and advanced R topics! You make learning R easy for the rest of us! I will be sharing my amazing experience with all my public health and data science colleagues ! I would also like to give Charlie a BIG shout out for being so resourceful to help us students get through the course material in the least painful way throughout the semester ~Atty!