Tidy Data Rule #1: Every Column is a Variable
This lesson is called Tidy Data Rule #1: Every Column is a Variable, part of the Going Deeper with R course. This lesson is called Tidy Data Rule #1: Every Column is a Variable, part of the Going Deeper with R course.
Transcript
Click on the transcript to go to that point in the video. Please note that transcripts are auto generated and may contain minor inaccuracies.
View code shown in video
# Load Packages -----------------------------------------------------------

library(tidyverse)
library(fs)
library(readxl)
library(janitor)

# Create Directories ------------------------------------------------------

dir_create("data-raw")

# Download Data -----------------------------------------------------------

# https://www.oregon.gov/ode/educator-resources/assessment/Pages/Assessment-Group-Reports.aspx

# download.file("https://www.oregon.gov/ode/educator-resources/assessment/Documents/TestResults2122/pagr_schools_math_tot_raceethnicity_2122.xlsx",
#               mode = "wb",
#               destfile = "data-raw/pagr_schools_math_tot_raceethnicity_2122.xlsx")
#
# download.file("https://www.oregon.gov/ode/educator-resources/assessment/Documents/TestResults2122/TestResults2019/pagr_schools_math_tot_raceethnicity_1819.xlsx",
#               mode = "wb",
#               destfile = "data-raw/pagr_schools_math_tot_raceethnicity_1819.xlsx")
#
# download.file("https://www.oregon.gov/ode/educator-resources/assessment/TestResults2018/pagr_schools_math_raceethnicity_1718.xlsx",
#               mode = "wb",
#               destfile = "data-raw/pagr_schools_math_raceethnicity_1718.xlsx")
#
# download.file("https://www.oregon.gov/ode/educator-resources/assessment/TestResults2017/pagr_schools_math_raceethnicity_1617.xlsx",
#               mode = "wb",
#               destfile = "data-raw/pagr_schools_math_raceethnicity_1617.xlsx")
#
# download.file("https://www.oregon.gov/ode/educator-resources/assessment/TestResults2016/pagr_schools_math_raceethnicity_1516.xlsx",
#               mode = "wb",
#               destfile = "data-raw/pagr_schools_math_raceethnicity_1516.xlsx")


# Import Data -------------------------------------------------------------

math_scores_2021_2022 <-
  read_excel(path = "data-raw/pagr_schools_math_tot_raceethnicity_2122.xlsx") |>
  clean_names()


# Tidy and Clean Data -----------------------------------------------------

third_grade_math_proficiency_2021_2022 <-
  math_scores_2021_2022 |>
  filter(student_group == "Total Population (All Students)") |>
  filter(grade_level == "Grade 3") |>
  select(academic_year, school_id, contains("number_level")) |>
  pivot_longer(cols = starts_with("number_level"),
               names_to = "proficiency_level",
               values_to = "number_of_students")
Your Turn
Do the following to create a new data frame called enrollment_by_race_ethnicity_2022_2023:
Start with the
enrollment_2022_2023data frame.select()thedistrict_institution_idandschool_institution_idvariables as well as those about number of students by race/ethnicity and get rid of all others.Use
pivot_longer()to convert all of the race/ethnicity variables into one variable.Within
pivot_longer(), use thenames_toargument to call that variablerace_ethnicity.Within
pivot_longer(), use thevalues_toargument to call that variablenumber_of_students.
Start with the code below.
# Load Packages -----------------------------------------------------------

library(tidyverse)
library(fs)
library(readxl)
library(janitor)

# Create Directories ------------------------------------------------------

dir_create("data-raw")

# Download Data -----------------------------------------------------------

# https://www.oregon.gov/ode/reports-and-data/students/Pages/Student-Enrollment-Reports.aspx

# download.file("https://www.oregon.gov/ode/reports-and-data/students/Documents/fallmembershipreport_20222023.xlsx",
#               mode = "wb",
#               destfile = "data-raw/fallmembershipreport_20222023.xlsx")
#
# download.file("https://www.oregon.gov/ode/reports-and-data/students/Documents/fallmembershipreport_20212022.xlsx",
#               mode = "wb",
#               destfile = "data-raw/fallmembershipreport_20212022.xlsx")
#
# download.file("https://www.oregon.gov/ode/reports-and-data/students/Documents/fallmembershipreport_20202021.xlsx",
#               mode = "wb",
#               destfile = "data-raw/fallmembershipreport_20202021.xlsx")
#
# download.file("https://www.oregon.gov/ode/reports-and-data/students/Documents/fallmembershipreport_20192020.xlsx",
#               mode = "wb",
#               destfile = "data-raw/fallmembershipreport_20192020.xlsx")
#
# download.file("https://www.oregon.gov/ode/reports-and-data/students/Documents/fallmembershipreport_20182019.xlsx",
#               mode = "wb",
#               destfile = "data-raw/fallmembershipreport_20182019.xlsx")

# Import Data -------------------------------------------------------------

enrollment_2022_2023 <- read_excel(path = "data-raw/fallmembershipreport_20222023.xlsx",
                                   sheet = "School 2022-23") |>
clean_names()Learn More
There is also a pivot_wider() function that does the opposite of pivot_longer(). You'll learn about this in the Tables lesson.
R for the Rest of Us consultant Albert Rapp has written a couple blog posts on basic and advanced pivoting.
Below, I've embedded a website made by Hasse Walum that provides a visual representation of how the pivot_longer() function works.
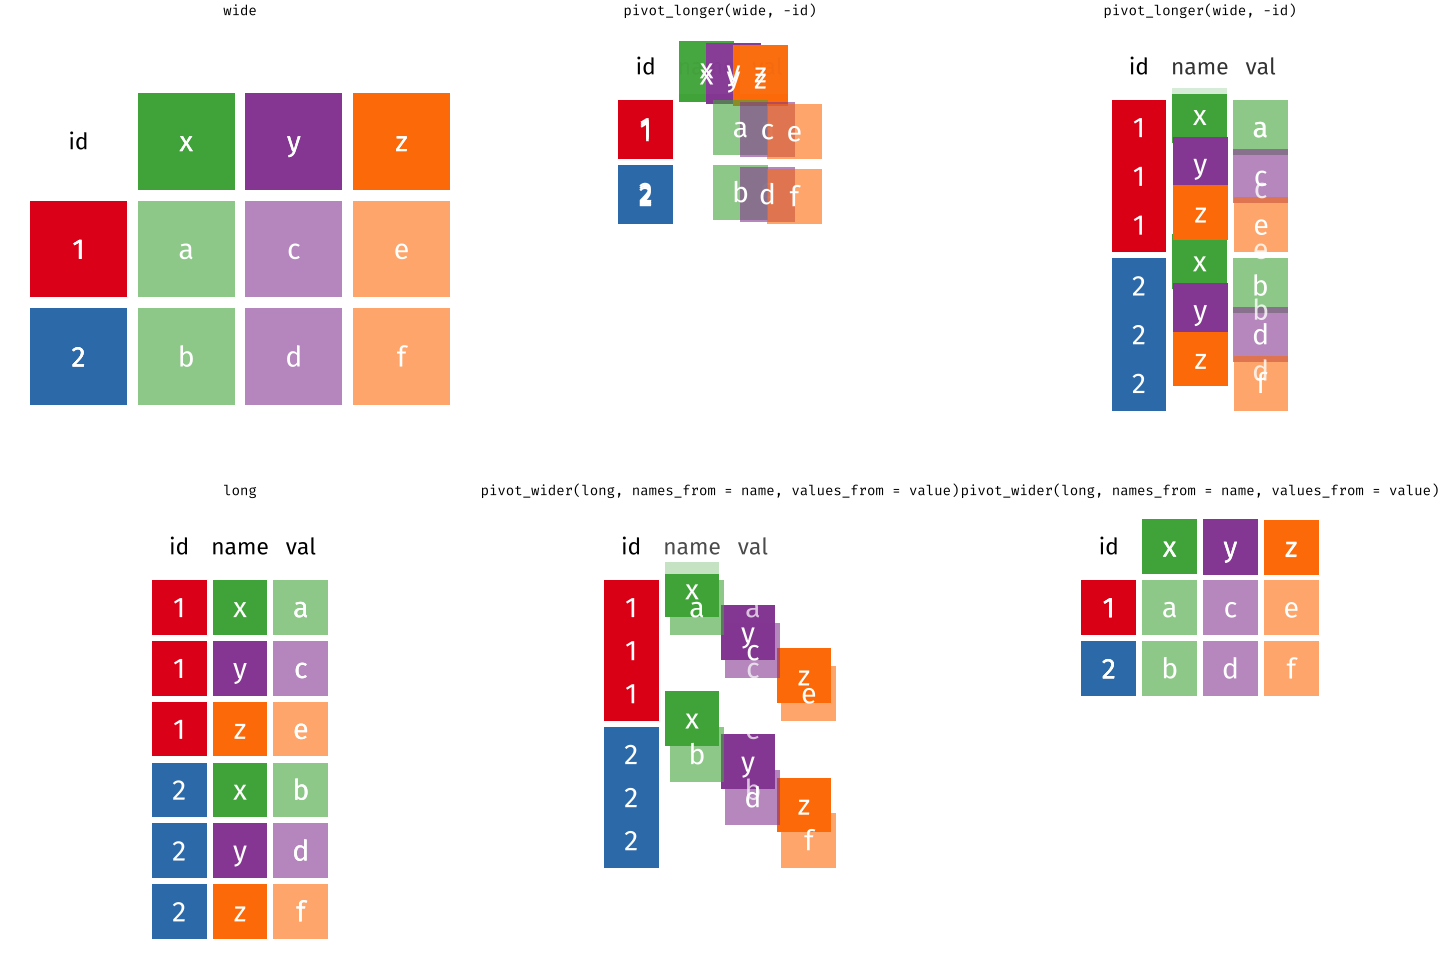
There’s also a nice article by Gavin Simpson of University College, London about pivoting. That article includes the animations below, made by Garrick Aden-Buie and Mara Averick, that gave a visual demonstration of pivoting.
Posit has a nice primer on reshaping data, complex with a few exercises.
Finally, a heads up: if you ever see references to the functions gather() and spread(), these are the previous iterations of the pivot functions. They still work (as the tweet below from tidyverse developer Hadley Wickham indicates), but the pivot functions are, in my view (and the view of many others), much easier to use.
Have any questions? Put them below and we will help you out!
Course Content
44 Lessons

You need to be signed-in to comment on this post. Login.
Kara Stewart • October 17, 2024
For the your turn section, to select the columns we want to work with, I was using the -contains() function to remove columns that contain "percent". If I include the district_institution_id etc in the select parenthesis, it is not reading that information and my data contains all columns that don't have "percent" in them. Here is my code.....help would be appreciated.
David Keyes Founder • October 19, 2024
Before we look into this, just a quick note to say that you have an extra pipe (see here). If you fix that, does it solve the issue? If not, we can look into it further.
Kara Stewart • October 23, 2024
Yep, that fixed it. Ugh.....thanks.
David Keyes Founder • October 23, 2024
Happens to me all the time!
Gabrielle van Son • February 28, 2025
Hi! Just a question from real life. What if you want to pivot multiple sets in multiple columns. What to do in those cases? Thank you!
Gracielle Higino Coach • March 1, 2025
Hi Gabrielle! That's a very common situation for people dealing with surveys! The answer is a bit advanced for this course, but I'll demonstrate here. You need to know a bit about regular expressions, and this website can help you create the right query: https://regexr.com/
In this first example, you want to take the penguins data and pivot the measures in mm and the ones in g to different columns, and have the value of the measurement in yet another column. You need to select the columns and tell R where the names go, and what part of the column names are the variables now.
You can also do this using multiple pivots, especially when you want to make sure your grouping is well described in your code. In the example below, I want to make sure to capture the columns containing the letter "m" into their own group, and the ones containing the letter "f" into their own group. Each point in the regular expression in the
names_patternargument tells R to take that pattern and turn into the values of my variable.You can try the first example above by loading the package
palmerpenguins. The second one uses the who dataset, which comes with base R, you don't need to load anything. 😊If you want to dig deeper, take a look at this documentation page: https://tidyr.tidyverse.org/articles/pivot.html#many-variables-in-column-names
Gabrielle van Son • March 1, 2025
Hi Gracielle, thank you for your elaborate response! This is very helpful!!!